

Disclosure: I am long Haivision Systems Inc. (TSX: HAI) in personal accounts. CAPY Research and its principal may buy or sell securities discussed here at any time. I received no compensation from Haivision or any other issuer or third party for this post. This is research and commentary, not investment advice.
The general cadence of these deep dives will first be to give the CAPY outputs. I’ll assume you either read these in full or delegate to your LLM of choice for a summary that fits your level of commitment. I’ll then take our collective understanding of the business and CAPY’s valuation as a given, and give my “Trainer Notes” in a second section where I help contextualize, refine and drill into the key pivot points.
Haivision Systems Inc. (TSX: HAI)
Equity Research Report
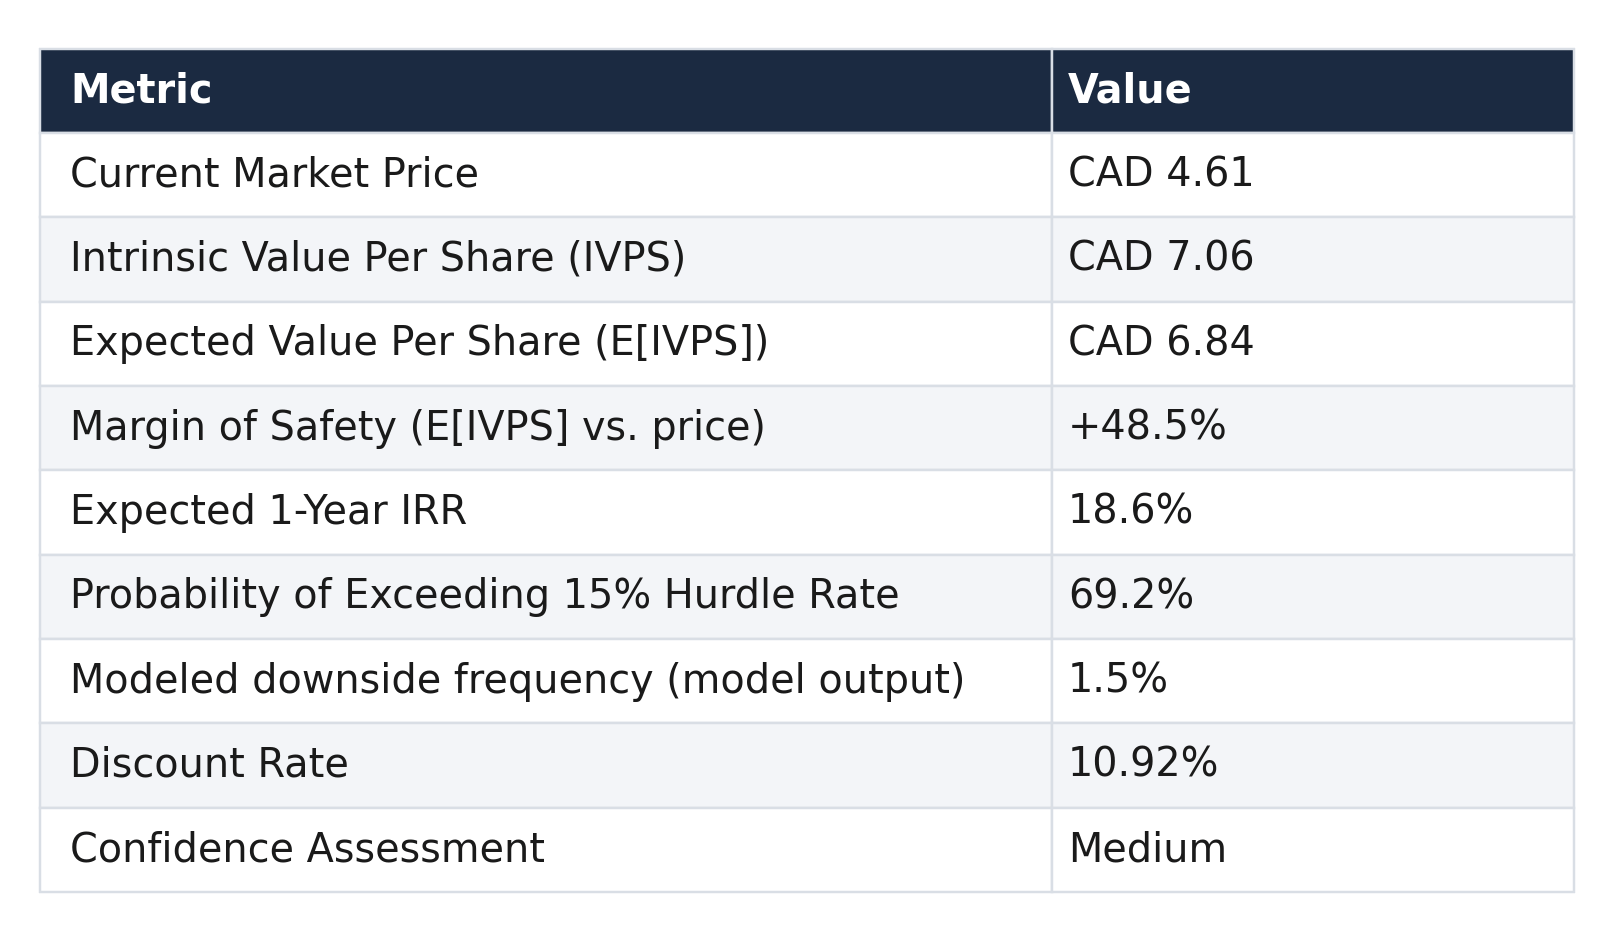
Date: 2026-06-22 Intrinsic Value Per Share: CAD 7.06 Expected Value Per Share: CAD 6.84 Expected 1-Year Return (IRR): 18.6%
What the model sees
Executive Summary
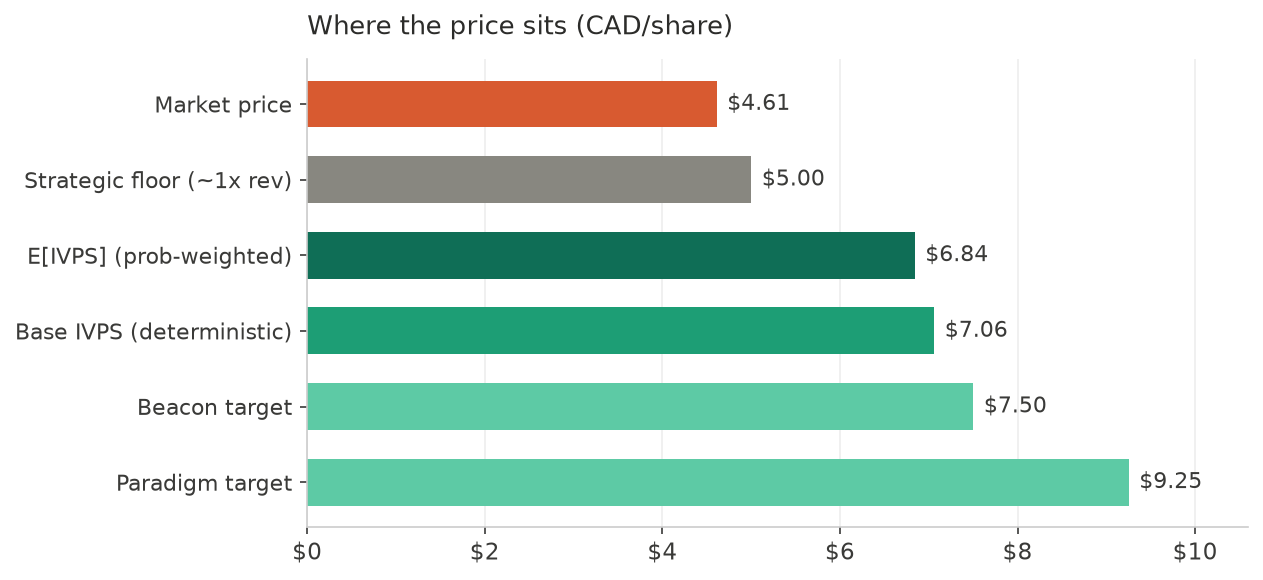
Haivision Systems is a small-capitalization, net-cash provider of mission-critical, low-latency video infrastructure that trades near its 52-week low because the market is extrapolating a temporary fiscal-2026 earnings trough into permanence. We estimate intrinsic value at CAD 7.06 per share on a deterministic basis and CAD 6.84 per share on a probability-weighted basis — roughly 48% above the current quote of CAD 4.61— and we forecast an expected one-year total return of 18.6%. The thesis is not a growth story but a margin-normalization story: an operating margin that sits at approximately breakeven today is poised to recover toward a 12% terminal level, driven in significant part by mechanisms that are contractual rather than discretionary.
The central economic question is narrow and falsifiable: does the fiscal-2026 gross-margin and operating-margin trough reverse, or does it persist? Three largely revenue-independent mechanisms support reversal. First, acquired-intangible amortization rolls off at roughly CAD 3.8 million per year as the technology assets from two prior acquisitions reach the end of their amortization schedules — a structural uplift that is a function of acquisition anniversaries, not execution. Second, operating leverage on a cost base that is roughly two-thirds fixed expands margins as revenue scales. Third, gross margin normalizes from a depressed level toward the mid-70s as pricing actions and a richer proprietary product mix flow through. Layered on top is a revenue inflection expected around fiscal 2028, when a large U.S. defense program is management-framed to “kick into gear.” The balance sheet removes financial risk from the equation entirely: the company holds net cash of CAD 11.1 million and a largely undrawn CAD 35 million revolving facility.
Key catalysts:
The dated roll-off of acquired-intangible amortization (the largest single technology tranche fully amortizes in August 2026, the second in April 2027), which mechanically lifts reported operating margin inside the next twelve months.
Quarterly gross-margin and operating-margin prints through fiscal 2027 that confirm the direction of the recovery off the trough.
The fiscal-2028-weighted ramp of the anchor U.S. Navy program and broader NATO / Five-Eyes defense procurement.
An active share-repurchase program and a demonstrated strategic-takeover floor (a ~10% strategic holder previously had bids in the CAD 4.50–4.75 range rejected).
Key risks:
Component-cost inflation (memory and compute) that the chief financial officer has flagged as “still to come,” which could keep margins depressed longer than the amortization roll-off helps.
High operating leverage that cuts both ways — the same mechanism that drives recovery collapsed adjusted EBITDA roughly 80% on a 5% revenue decline in the most recent quarter.
An existential but low-probability litigation tail: a claimant has appealed a trial judgment, with the original claim (approximately CAD 132.7 million) close to the entire market capitalization.
Indefinite timing of the anchor defense program, whose return to full delivery cadence has “no defined timetable.”
On balance, the risk/reward is favorably asymmetric from the current price. The probability-weighted value distribution is symmetric and multi-modal, spanning roughly CAD 0.93 to CAD 10.87, with its tenth percentile (CAD 4.60) sitting almost exactly at today’s quote and a net-cash balance sheet that keeps every modeled outcome positive. The market is pricing more trough-persistence pessimism than either our base case or the constructive sell-side (published fair values of CAD 7.50 (Beacon) and CAD 9.25 (Paradigm) both sit above our deterministic estimate, placing it at the conservative end of the constructive range). We view Haivision as undervalued, with the dominant uncertainty — the durability of the margin recovery — concentrated precisely where it should be, and increasingly observable as the next several quarterly prints arrive.
Business Model & Competitive Position
Haivision sells mission-critical, low-latency video infrastructure across two go-to-market lines that the company reports as a single operating segment. Mission Systems serves defense, intelligence-surveillance-reconnaissance (ISR), and public-safety customers with products such as the Makito encoder family, the Kraken KX1 and Kobra platforms, and command-center / high-performance media solutions. Broadcast & Media serves broadcasters and content owners with products such as Makito ONE, the Falkon 5G transmitter line, and the StreamHub receiver. The unifying capability is reliable, secure, low-latency transport of high-value video over constrained or contested networks — a capability whose value is highest precisely where failure is least acceptable.
Because the company discloses revenue only by type rather than by end-market, the type split is the spine of the analysis. In fiscal 2025, product revenue (hardware plus perpetual licenses) was CAD 101.5 million, or 73.8% of the total; recurring revenue (maintenance and support plus cloud) was CAD 28.9 million, or 21.0%; and services and other was CAD 7.2 million, or 5.2%. Product is recognized at a point in time, is the locus of the gross-margin lever, and carries the company’s exposure to component costs and mix. Recurring revenue is recognized over time, carries roughly 75% repeat rates on maintenance contracts, generates a deferred-revenue float, and is the stickiest and most defensible stream. Services is lumpy and structurally declining as the company deliberately exits a third-party systems-integration model in favor of proprietary manufacturing. Geographically, the business is anchored in the United States (roughly 70% of revenue), with international (chiefly Europe) at roughly 28% and Canada under 2%.
The competitive moat is best understood as a combination of switching costs and mission-criticality rather than scale. In defense and public-safety deployments, the product is embedded in workflows where reliability and security certification matter more than price, procurement cycles are long, and incumbency is durable; the anchor U.S. Navy relationship is a multi-year production agreement, not a transactional sale. In broadcast, the installed base and the recurring maintenance book create a renewal annuity. The company’s gross margin of roughly 70–73% sits at or above its peer set, which is consistent with genuine product differentiation rather than commoditized hardware resale. The competitive vulnerabilities are equally clear: the business is sub-scale, exposed to discretionary IT and broadcast capital budgets, and dependent on a component supply chain it does not control.
Management has built the company partly through acquisition — the MCS and AVIWEST transactions are the source of the goodwill-heavy balance sheet — and has demonstrated a margin-first, disciplined response to the current cost cycle. Specific stewardship signals include taking list-price increases, decoupling server hardware from software (moving toward higher-margin software and virtual-machine delivery even at the cost of CAD 1–2 million of reported revenue), and investing incrementally in inventory to secure component supply. Capital allocation is conservative: no dividend, an active normal-course issuer bid (repurchasing roughly 980,000 shares in the year to January 2026 and ~193,000 more in May-June 2026), and a net-cash balance sheet preserved for optionality. Insider and board ownership of approximately 33% (with the founder holding roughly 14.6%) aligns management with outside shareholders, though it also thins the float and reduces liquidity.
Strategically, the company is navigating a genuine but, on the evidence, temporary input-cost shock while positioning for a defense-spending super-cycle. The near-term posture is defensive on margin and offensive on international sales capacity (a deliberate build-out of roughly fifteen sales representatives). The medium-term bet is that mission-critical video becomes a larger line item in Western defense budgets as NATO members raise spending. These characteristics matter for valuation because they determine where value is created: not in unit-volume growth at thin margins, but in the recovery and expansion of margin on a high-gross-margin, asset-light, float-funded revenue base. The disclosure quality supports taking the recovery levers at face value — the company is a clean reporter whose by-type revenue, three-way cost-of-sales split, and amortization roll-off schedule are all explicitly disclosed, which is why a bottom-up reconstruction of the income statement reconciles exactly to reported figures.
Capital Efficiency & Returns
Haivision’s invested-capital base is best described as acquisition-built and goodwill-heavy. Operating invested capital at the fiscal-2026 anchor is approximately CAD 63.0 million, of which goodwill (CAD 46.8 million) represents roughly 74% — sunk acquisition consideration rather than operating assets requiring replacement. The remaining components are net acquired intangibles (CAD 4.1 million, themselves rolling off), net property and equipment (CAD 3.0 million, reflecting outsourced manufacturing), and operating net working capital of roughly CAD 8.3 million. This composition shapes how returns and reinvestment must be read.
Reinvestment is structurally low, and this is an accurate economic picture rather than a modeling artifact. Capital expenditure runs at roughly 1.5% of revenue because manufacturing is outsourced to contract manufacturers and product development is expensed as research and development rather than capitalized. Depreciation and amortization initially exceed capital expenditure, so net capital intensity is negative early and turns modestly positive only as the amortization rolls off. Changes in working capital are minimal because the maintenance and cloud deferred-revenue float (approximately CAD 17 million, or about 12.5% of revenue) partially funds working capital, and working-capital intensity declines as the recurring book grows faster than total revenue. The net effect is that invested capital barely grows over the twenty-year horizon (from CAD 63.0 million to CAD 78.2 million), while free-cash-flow margin runs around 8.5% on a 12% operating margin. For a genuinely asset-light, float-funded business sitting on an already-sunk acquisition base, incremental growth requires little new capital.
This creates an important and deliberately preserved tension in the return analysis. The modeled return on invested capital is uninformative at both extremes: it is approximately negative 0.9% at the trough (a cyclical artifact of negative operating profit) and climbs to 40–47% in the later years (an artifact of a goodwill-heavy capital base that grows slowly). Neither figure should drive valuation, and we flag the modeled return as low-reliability. Accordingly, terminal value is disciplined not by the modeled return but by an industry-median return-on-capital anchor of 13%, applied to normalize terminal reinvestment. The economic logic is straightforward: a competitor entering this space would not earn 40%-plus on fresh capital; it would earn roughly the industry median, and that is what should fund the terminal reinvestment math. Explicit-period cash flows reflect the genuine asset-light economics; terminal value applies a normalized, defensible return.
On capital structure, the company carries interest-bearing debt of CAD 6.9 million against cash of CAD 18.1 million — a net-cash position of CAD 11.1 million that adds directly to equity value and removes financial-distress risk from the discount rate. Covenant headroom is vast (a maximum funded-debt-to-EBITDA covenant of 3.75 times against actual leverage near 0.5 times), and the acquisition-related term loans are expected to be largely repaid by mid-fiscal-2027, trivially funded by operating cash flow of approximately CAD 8.7 million. The undrawn revolver, expandable toward CAD 60–65 million for acquisitions, preserves optionality to resume the roll-up strategy — an upside lever we hold out of the base case.
Market Context & Growth Ceiling
Haivision operates in a structurally favorable end-market that is, at present, partly obscured by a cyclical cost shock. The most important secular tailwind is the global rearmament cycle. Our research confirmed a strengthening and well-documented backdrop: a NATO pledge oriented toward 5%-of-GDP defense spending, a European “ReArm” initiative on the order of €800 billion, and record global military spending of roughly US$2.9 trillion. For a vendor of mission-critical ISR and command-center video, this is a multi-year demand expansion rather than a one-time bump. The company’s anchor relationship — confirmed in our research as the U.S. Navy / NAVSEA, via a five-year production agreement valued at roughly US$61.2 million (CAD 82 million) — anchors that exposure in a concrete, contracted program.
The growth ceiling is set less by addressable market than by the company’s own scale, conversion capacity, and the timing of program ramps. The base case re-keys an aggregate revenue path onto the three by-type streams: roughly 5% growth in the first forecast year (as component supply normalizes and early defense demand contributes), accelerating to roughly 10% around fiscal 2028 (the management-framed defense inflection), then fading toward a 3.5% terminal rate, for a roughly 5.4% twenty-year compound rate. This is deliberately moderate. The magnitude and timing of the defense ramp are idiosyncratic — the relevant program is described as “boats out at sea” with no defined return timetable — so the base path holds the inflection to a measured level and routes both the super-cycle upside and the program-slip downside to the scenario framework.
Several constraints temper the growth outlook. Revenue is concentrated: four customers accounted for 16.6% of fiscal-2025 revenue, and the unnamed anchor customer’s deliveries rose roughly threefold year-over-year, creating both opportunity and timing risk. The services line is in deliberate structural decline. The deliberate decoupling of server hardware, while margin-accretive, is a modest reported-revenue headwind. And the broadcast vertical remains exposed to discretionary capital budgets.
On governance, the picture is supportive of taking disclosed recovery levers at face value. The company is a clean reporter with an unqualified audit opinion, no going-concern or emphasis-of-matter flags, a single key audit matter (revenue recognition), and no history of goodwill impairment. Ownership is aligned (insiders and board at roughly 33%), capital return is conservative (buybacks, no dividend), and disclosure is detailed. The principal governance-adjacent frictions are the thin float and low trading liquidity (average daily traded value well under CAD 1 million), which we address as a liquidity adjustment in the return analysis rather than in the discount rate, and a founder-influenced control structure with a poison pill that could complicate, though has not prevented, strategic interest.
Research Findings
The deep-research phase investigated seven primary-source questions designed to test the load-bearing claims of the base case, and the dominant outcome was confirmation rather than revision. Of twenty input assumptions, all twenty were confirmed at value; only two took near-term shape refinements (the timing of the gross-margin recovery and the inventory build) — an honest result, not a default, reflecting that the initial estimate was already a carefully calibrated, median-anchored model. The research upgraded the base case from disclosure-plus-inference to primary-source-confirmed on every load-bearing claim and resolved several open uncertainties, without dislodging a single central estimate. What it did most usefully was narrow the bounds and sharpen the location of the remaining two-sided uncertainty. A bottom-up reconstruction of the fiscal-2025 income statement reconciles exactly to the reported figures, which is why we take the recovery levers at face value.
Three “lynchpin” assumptions received the most scrutiny. On the terminal operating margin (the single most important assumption), the chief financial officer’s statements confirmed the amortization roll-off as contractual: the larger MCS technology tranche fully amortizes around August 2026 (approximately CAD 0.6 million per quarter) and the AVIWEST tranche around April 2027 (approximately CAD 0.35 million per quarter), for roughly CAD 3.8 million per year of expense reduction. The wedge between adjusted EBITDA and operating profit means a 12% operating margin corresponds to roughly an 18% adjusted-EBITDA margin — below management’s reaffirmed ~20% target, which has never been achieved and has been pushed into the fiscal-2028–29 window. A peer through-cycle comparison brackets 12% on both sides (peers ranging from roughly 4% at the low end to the low-20s at the high end). The estimate was confirmed at the median, with the execution-independent pillar (the roll-off) now verified and the execution-dependent pillars (operating leverage, gross-margin normalization) left as the genuine two-sided debate.
On revenue durability, the research resolved the identity of the anchor customer (U.S. Navy / NAVSEA) and confirmed that there have been no cancellations — the program is “shifting to the right” rather than away. The fiscal-2028 “kick into gear” is management framing, not a contractual date, so the timing remains indefinite even as the secular case strengthens. On gross margin and component cost, the research cleanly separated two drivers of the recent decline: defense-mix dilution (a record quarter of low-margin third-party-component deliveries, structurally fading as the company moves from integrator to manufacturer) and component-cost inflation. The latter is now confirmed durable — contract DRAM pricing more than doubled in the first half of calendar 2026 and NAND rose 70–75% in the quarter, with normalization expected no earlier than late 2027 or 2028. Offsets include server decoupling (software at roughly 100% margin), list-price actions, and the historical original-equipment-manufacturer recovery lag of two to four quarters.
The net effect of research on valuation was approximately neutral, and that is the key finding: new information pressuring the near term downward (a durable component cycle, indefinite defense timing) was genuinely offset by new information supporting the case (an episodic defense-mix reversal, server decoupling, the contractually confirmed amortization roll-off, and the secular defense super-cycle). The residual is two-sided dispersion that belongs in the scenario framework, not a shift in the operating base. The principal remaining information gap is timing: neither the terminal margin level nor the precise defense-ramp date can be resolved from current sources, which is why both are expressed as discrete scenarios rather than point estimates.
Risk Assessment
Haivision’s risk profile is dominated by a single systematic factor and a small set of well-defined idiosyncratic tails. We assess overall risk as moderate-to-elevated, appropriately compensated at the current price.
Systematic risks. The dominant systematic factor is high operating leverage. With a cost base that is roughly two-thirds fixed, revenue volatility is amplified into earnings volatility — vividly demonstrated in the most recent quarter, when a 5.1% revenue decline collapsed adjusted EBITDA by roughly 80% (from CAD 1.7 million to CAD 0.3 million). This is the single most important market-correlated risk and the primary reason our systematic-risk scalar sits in the “high” band. Secondary systematic factors include discretionary capital-budget and IT-spending cyclicality in the broadcast and enterprise verticals, exposure to the global semiconductor and AI-driven component cycle (memory and compute input costs), and a small-cap, transition-to-profitability profile that is longer-duration and more rate-sensitive. These are partially offset by a meaningful (~30%-plus) defense and government revenue ballast that is relatively non-cyclical, and by the net-cash balance sheet, which removes financial-leverage amplification. The net assessment places the systematic-risk scalar at 1.60 and the discount rate at 10.92%.
Idiosyncratic risks. Per our framework, company-specific and diversifiable risks are modeled explicitly in the cash flows (through the scenario framework) rather than buried in the discount rate. The principal idiosyncratic exposures are:
Litigation tail. A claimant has appealed (filed May 2025) a trial judgment that awarded only CAD 631,000 against an original claim of approximately CAD 132.7 million — close to the entire market capitalization. The appellate verdict most likely lands beyond a one-year horizon, but the binary outcome is existential and is modeled as a discrete adverse scenario.
Defense-program timing. The anchor program’s return to full delivery cadence has no defined timetable; this shifts revenue in time rather than removing it, but the timing is genuinely uncertain and modeled on both the upside (super-cycle) and downside (slip) axes.
Customer concentration. Four customers represent 16.6% of revenue, with the anchor customer’s deliveries up roughly threefold — a company-specific dependency.
Component-shock magnitude and duration. How quickly pricing and decoupling actions offset cost inflation is an execution variable.
Acquisition-integration risk should the roll-up strategy resume.
Other risks include translation volatility (the parent’s functional currency is the U.S. dollar while the financials are presented in Canadian dollars) and the thin trading liquidity, addressed via a 3.75% liquidity adjustment applied at the return stage rather than in the discount rate.
Risk-return assessment. The compensation for these risks is visible in the return distribution. The model’s one-year downside frequency is only 1.5%, though that figure is a scenario-kernel output under convergence assumptions rather than a literal probability of loss (the value distribution puts ~4-6% of its mass below today’s price). The probability of exceeding the 15% hurdle rate is 69.2%, against an expected return of 18.6%. The deepest feasible modeled outcome (a simultaneous margin trough, adverse litigation reversal, and revenue slip) still leaves equity value positive at CAD 0.93 per share, because the net-cash balance sheet floors the practical downside. The dominant unresolved question is not solvency or financial risk but a single operating variable — whether the margin recovery materializes — which makes the risk unusually legible. We characterize the overall risk as concentrated, well-defined, and adequately priced: this is a name where the principal way to lose money is a persistent margin trough compounded by a low-probability legal shock, not a balance-sheet failure or a thesis that depends on heroic growth.
Growth & Margin Forecast
The growth-investment model translates the structural framework into a twenty-year schedule of driver values. The organizing thesis is margin normalization with a moderate revenue tailwind, not aggressive top-line growth.
On revenue, the three streams grow on a common path: roughly 5% in the first forecast year (component-supply normalization and early defense demand), accelerating toward the fiscal-2028 defense inflection, then fading to a 3.5% terminal rate. Aggregate revenue rises from CAD 141.0 million at the anchor year to CAD 205.1 million by year five, CAD 271.9 million by year ten, and CAD 404.4 million by year twenty. The compound growth rate decelerates smoothly — 7.8% over the first five years, 5.8% over the next five, 4.4%, then 3.7% — reflecting a maturing business converging toward nominal GDP. The recurring stream is modeled at the aggregate path on a constant-mix basis, with the qualitative understanding that it is the stickiest and most defensible component; the services stream’s structural decline is folded conservatively into the aggregate.
On margin, the trajectory is the heart of the valuation. The operating margin recovers from approximately negative 0.5% at the anchor year to 10.5% by year five and 12.0% from year ten onward. Three drivers carry this: the direct-product-cost intensity, which is held elevated in the near term (reflecting the durable component-cost cycle) before easing toward its terminal level; the operating-overhead intensity, which fades from 23.3% in the first year to 20.0% terminally and embeds both the amortization roll-off and below-gross-profit operating leverage; and the acquired-intangible amortization, which steps down sharply (from CAD 4.7 million at the anchor year to roughly CAD 1.95 million in year one, then to zero by year five) as the technology tranches fully amortize.
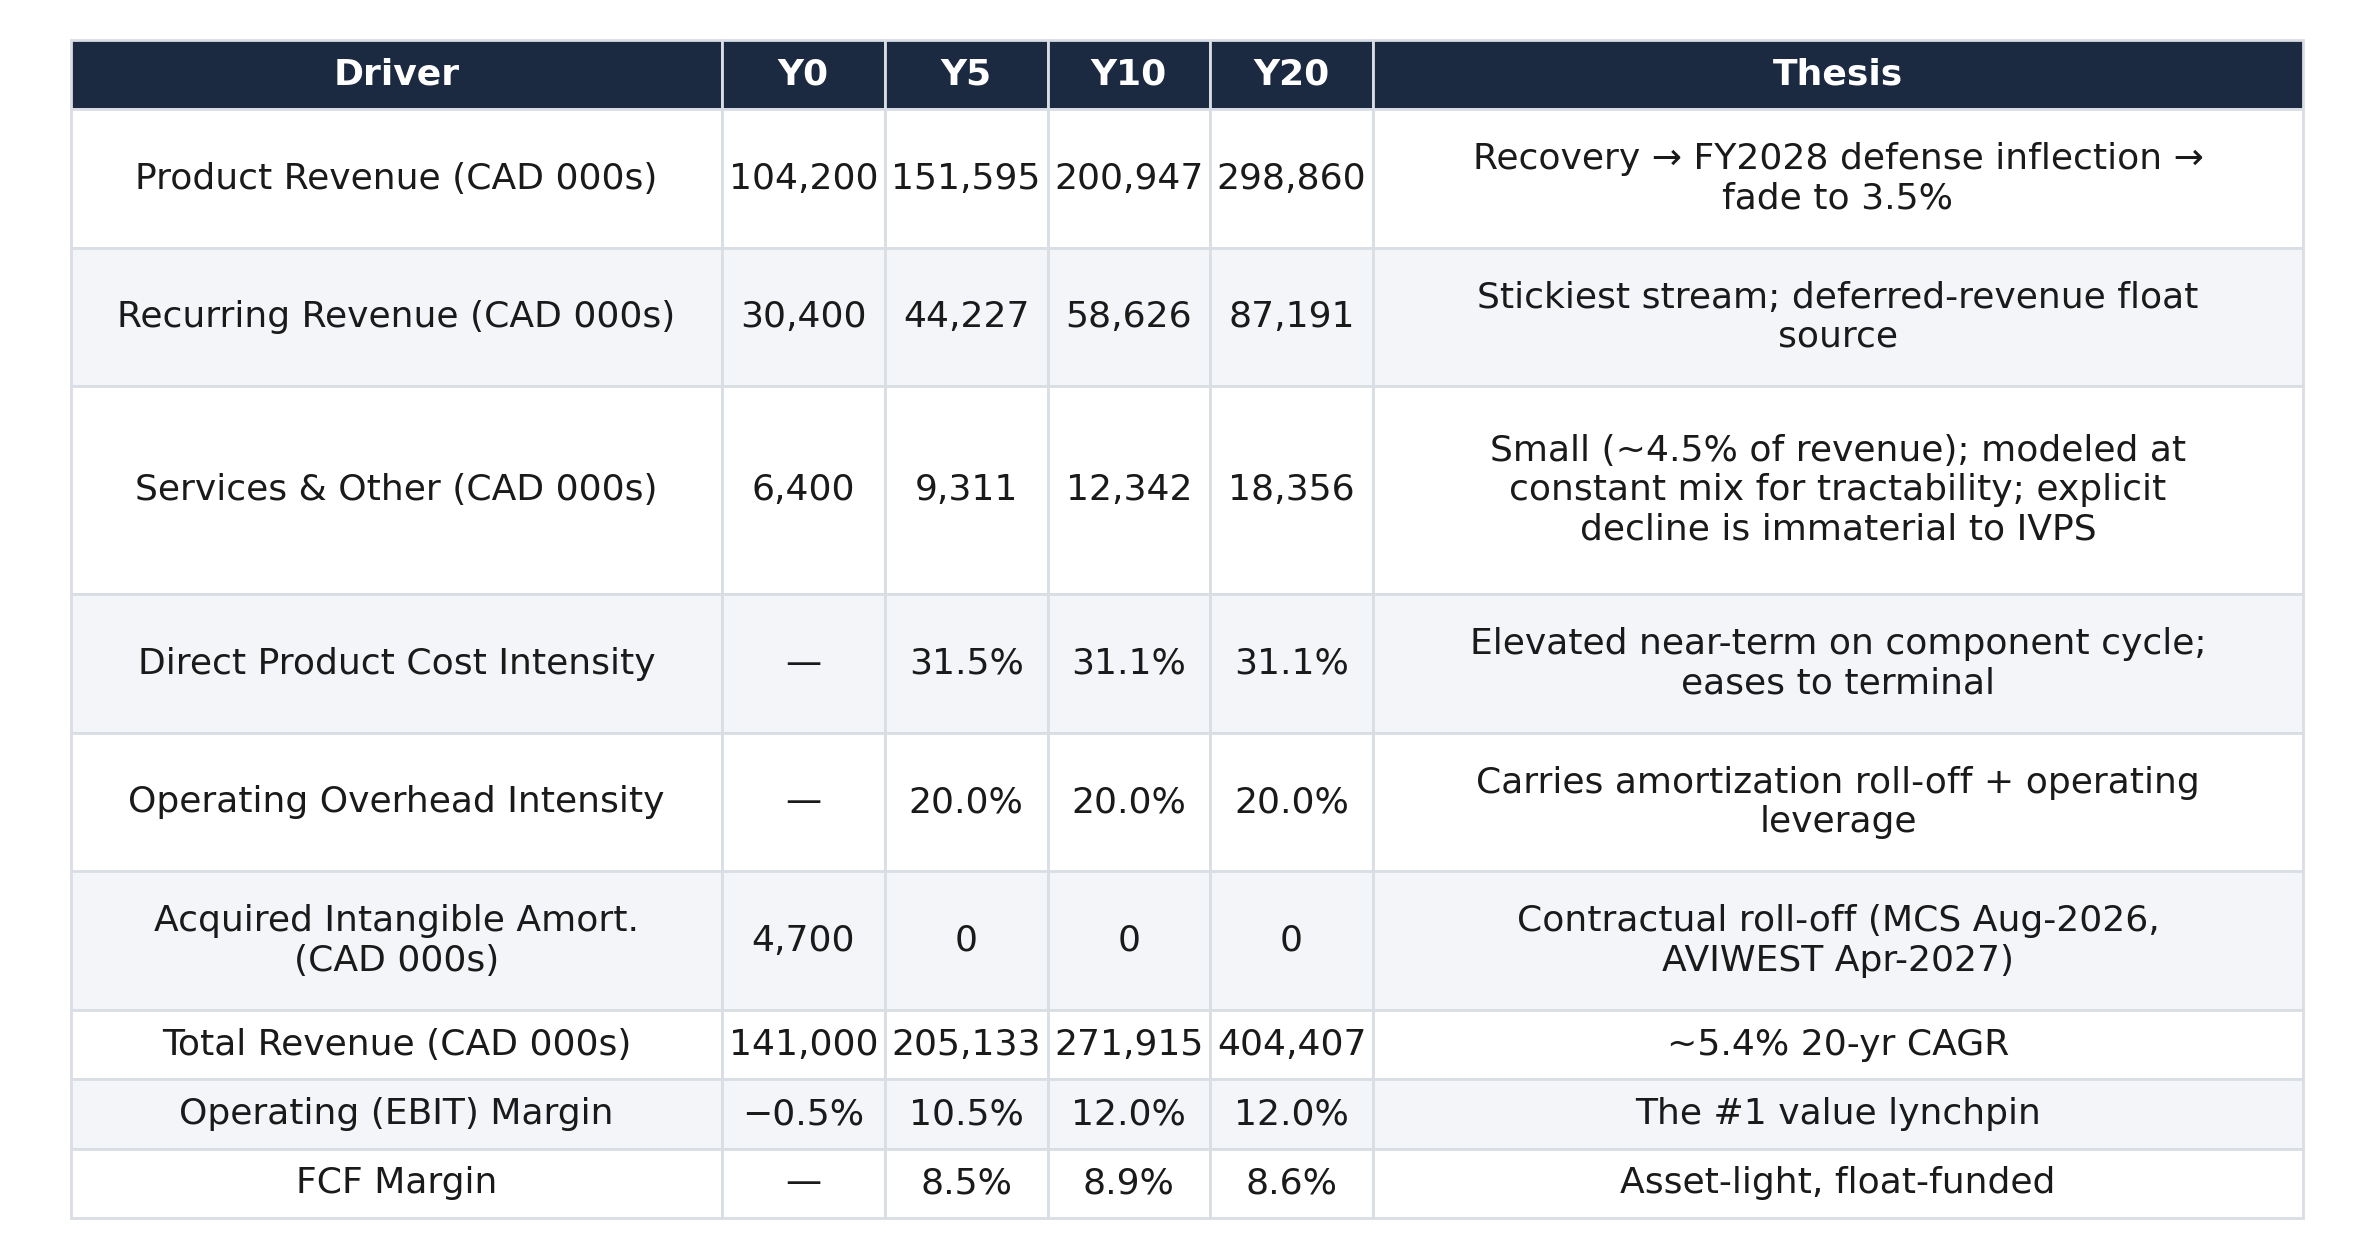
The principal inflection occurs between the anchor year and year five, where the operating margin expands roughly 11 percentage points — the recovery off the trough. By year ten the margin reaches its terminal 12% and holds, while revenue growth continues to decelerate toward the terminal rate. The amortization roll-off is the most reliable component of the recovery (it is contractual), contributing roughly 2.6 percentage points; the operating-leverage and gross-margin-normalization components are execution-dependent and carry the genuine two-sided risk.
Research findings updated the shape of the near-term path without changing the destination. Specifically, the direct-product-cost intensity was held elevated longer than initially modeled, deferring the gross-margin recovery to reflect primary-source evidence that the component-cost peak coincides with the near-term forecast years — a small negative to near-term cash flow within a twenty-year model, with the terminal level unchanged. The inventory intensity was modeled elevated near-term (11.0% versus a 9.0% terminal level) to reflect deliberate supply-securing purchases. Every other driver was confirmed.
The terminal assumptions are deliberately conservative. Terminal growth of 3.5% is capped at the long-term nominal-GDP rate and sits at the risk-free rate. The terminal operating margin of 12% sits below management’s own reaffirmed adjusted-EBITDA target (which would imply roughly 16% operating margin) and at the median of the plausible range. Terminal reinvestment is disciplined by the 13% industry return-on-capital anchor rather than the model’s optimistic computed return. The result is a model in which terminal value is a moderate share of intrinsic value, with the explicit-period margin recovery doing the work.
Discount rate
We discount at 10.92% in Canadian dollars: a 3.4% risk-free rate plus a revenue-weighted ~4.7% equity risk premium, scaled up for the stock’s high operating leverage. The discount rate is not the swing factor here; the margin trajectory is.
Scenario Analysis
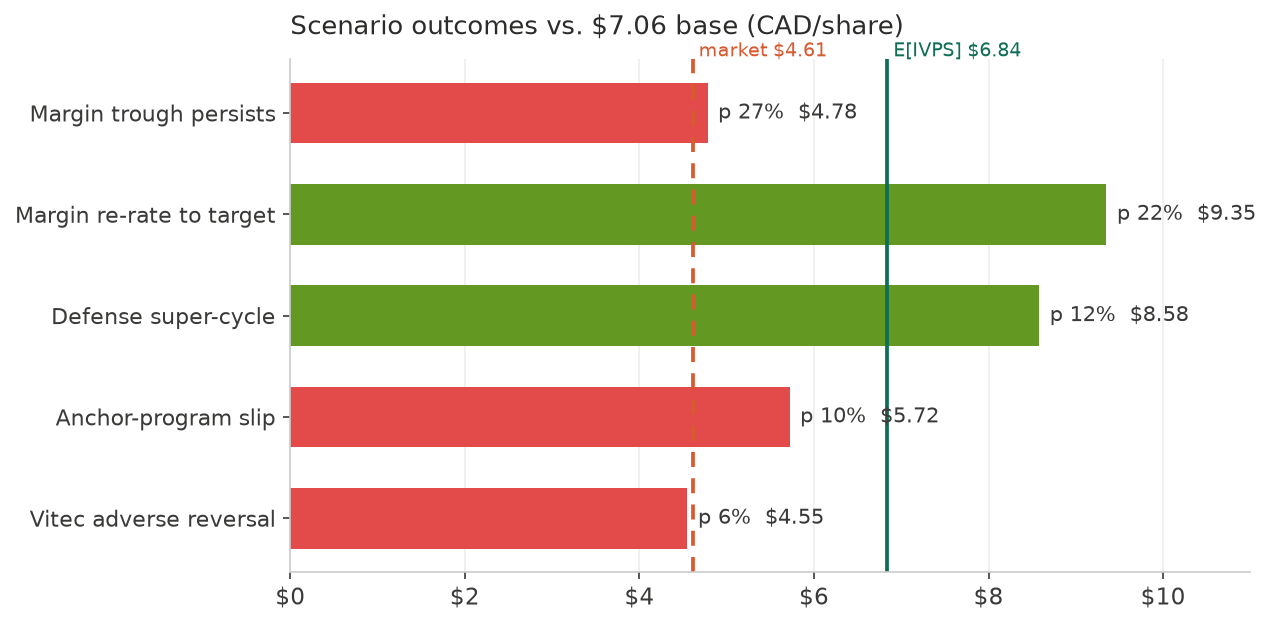
The scenario framework replaces the single deterministic value of CAD 7.06 per share with a probability-weighted distribution built from discrete, idiosyncratic interventions on the base model. Each scenario is a parameter overlay — adjusting specific drivers — with no change to the underlying structure and no change to the discount rate (the idiosyncratic risks were already excluded from the systematic-risk scalar). The scenarios were chosen to resolve the two central uncertainties along deliberately disjoint axes, so they compose cleanly: a margin axis (whether the terminal margin settles at the low or high end of its range) and a revenue axis (whether the defense revenue breaks out or stalls), plus a one-time legal tail.
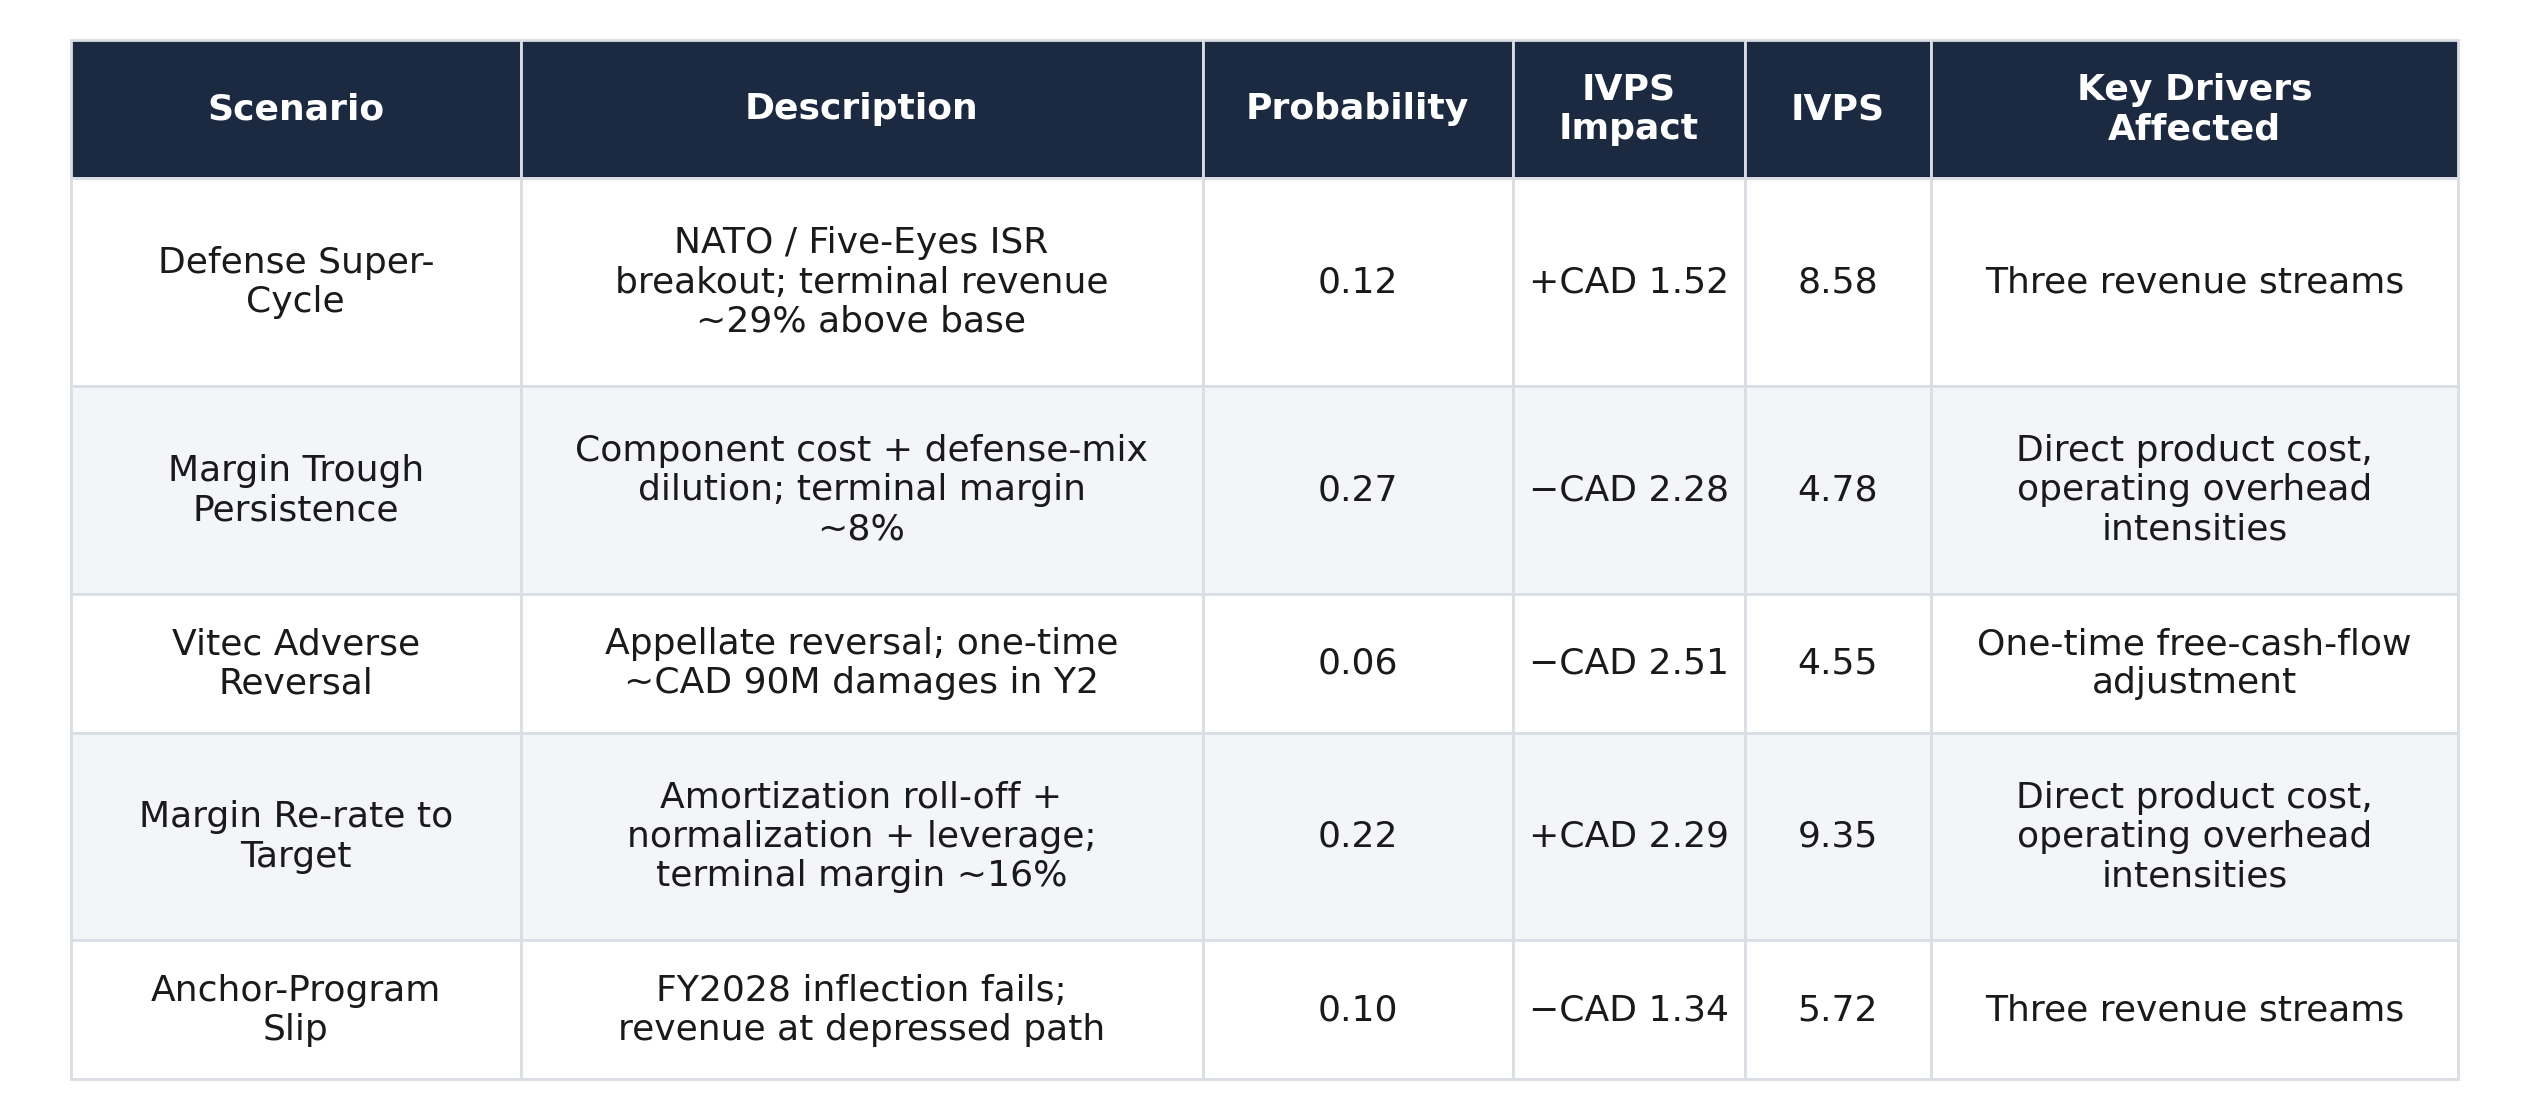
The two margin scenarios are mutually exclusive — the terminal margin cannot settle simultaneously at the low (~8%) and high (~16%) ends — so they are filtered when co-active. The base case (no scenario firing) carries ~43% of the probability mass before renormalization, and remains the single most-likely state at ~46% once the incompatible combinations are removed. The defense super-cycle is held economically incompatible with both the adverse litigation reversal (a transformative super-cycle and an existential legal loss cannot coherently coexist) and the anchor-program slip (revenue cannot both break out and stall). These constraints reduce the thirty-two possible combinations to fifteen feasible ones.
The expected value calculation weights each feasible combined state by its probability and sums the resulting per-share values, yielding a probability-weighted intrinsic value of CAD 6.84 per share — a CAD 0.22 (−3.1%) discount to the deterministic base, and roughly 48% above the current market price. The probabilistic lens does not overturn the base; it re-frames the risk around it. The most probable single state remains the base itself (a roughly 46% mode), flanked by a bear cluster around CAD 4.5–5.7 (from the margin trough, litigation, and revenue-slip scenarios, near the current market price) and a bull cluster around CAD 8.6–9.3 (from the super-cycle and margin re-rate scenarios).
Trainer Notes
Haivision (TSX:HAI) is a deeply unlovable bargain. HAI is a solid niche quality hardware provider, trading at <1x EV/Rev with massive operating leverage if it can deliver on even modest growth. On a strategic-takeover basis, it’s hard to imagine it’s worth less than C$5. The risk and the catalyst are two sides of the same coin: management promises high single digit / low double digits topline growth and consistently underperforms. Should we trust them?
Before I contrast with CAPY’s take, let me paint the broad bull/bear cases for HAI. The bull case is actually quite compelling structurally: HAI is a quality compounder and the leader in their small but mission critical niche. With ~70% gross margins, little debt, and a relatively fixed cost structure, they’re the beneficiary of strong operating leverage. As secular growth in their niche and new contracts roll in we expect HAI to quickly inflect to profitability, causing a rerating.
The problem? This already happened… multiple times.
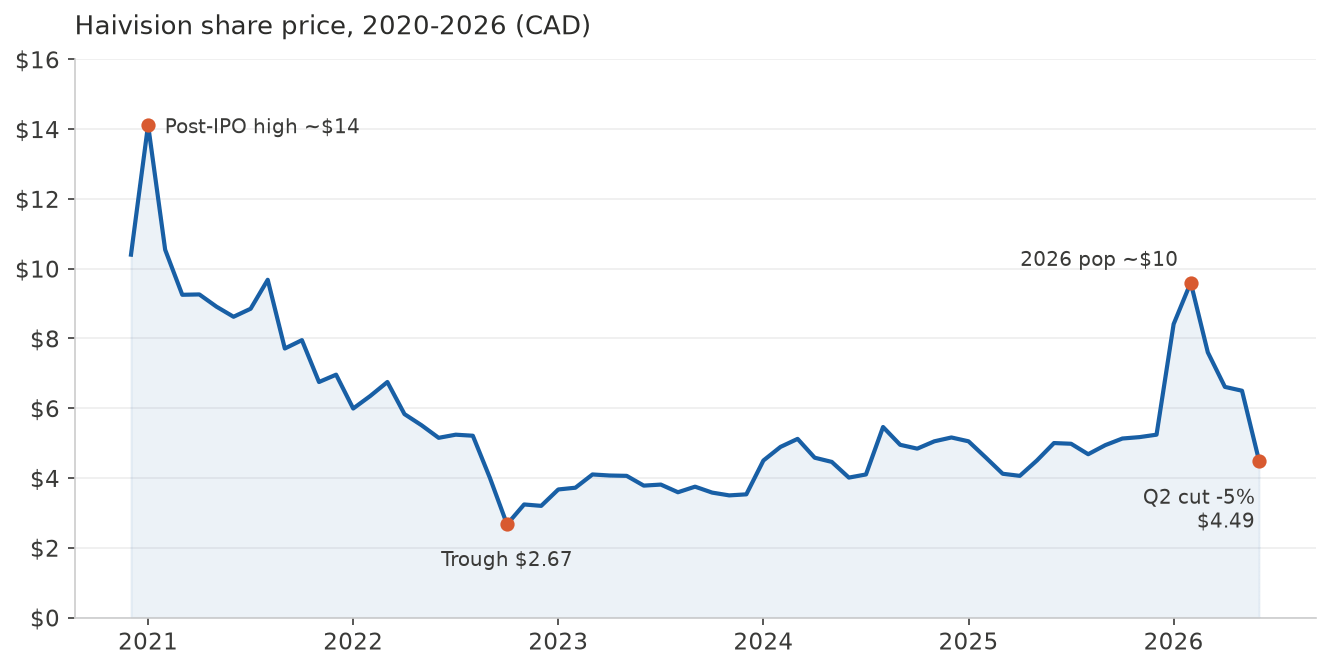
Shortly after going public HAI traded above its most recent highs before heading downwards, shortly sticking its head above water to ~C$10/share on the back of 25%/33% YoY rev growth comps before eventually plummeting back down to ~C$4.5/share recently as YoY comps reversed to -5% topline and the quality compounder story of monotonic growth and operating leverage was scuttled for the umpteenth time.
Perhaps the worst part of the current reversal is that management as recently as the March 12, 2026 Q1 call said:
“And we have always said that to achieve 20% plus EBITDA performance for the full year, we will need to be at scale somewhere around $160 million range. I believe we are very close to delivering on this targeted EBITDA and demonstrate the full earnings potential of Haivision. Now 2026 is the year that will set us up for that 20% EBITDA performance in 2027. As mentioned previously, we have been investing in many new product development initiatives and seen introductions throughout 2025 and some which are yet to be announced. And we'll be launching some exciting products and innovative technology throughout this year and 2027 to keep building the revenue momentum for the foreseeable future.”
Compare this with Q2 2026 (the -5% comp):
“Thus, we are lowering our expectations for the full fiscal year. We are now anticipating revenue between $140 million and $142 million for fiscal 2026. And although we are monitoring supply chains closely, we expect margin compression resulting in margins closer to 70% in the near term.”
And Robert Young:
“Okay. And then the longer-term guidance that you've given or rough guidance, I should say, over the next 2 to 3 years, where you suggested you could see double-digit growth with a path to 20% EBITDA margins. I understand very difficult to understand where the macro goes from here, but just curious your level of confidence just seeing the long-term pipeline.”
And Miroslav Wicha:
“Yes, I mean I think we'll probably be better positioned, I would say, later in the year to go further. But right now, we — I mean, in our view and our plans, what we're seeing, our double-digit revenue growth is definitely going to be there. 20% EBITDA is absolutely targeted. We're looking probably closer to the end of '27 into '28 and '29, right? So that's when I say long term. It's — we're going to — once the large defense program kicks into gear, which should be planned for our fiscal '28, together with the supply chain changes and with all of our next-generation technology, all of our new products that we're announcing because we're announcing at an accelerated pace of products throughout the next 12 to 18 months. Those are all going to be kicking in. So I would expect 12 to 18 months, we're going to be on the road to what we said before.”
It’s actually worse than this if you read the full call; the margin pressure hasn’t fully kicked in yet, and there appears to be some tension between the optimism of the CEO vs. the realism of the CFO on the call.
Thus the bear case in a nutshell: if you’re a quality compounder Mr. Market will need some evidence of actual compounding. Instead, we get CEO Wicha guiding to 20% ‘27 adj. EBITDA margins and 10%+ topline growth while YoY we go from +25% growth to -5% and reduce our 2026 guidance and push our medium term guidance outward. Perhaps the strangest part of this story is that HAI should have pretty good visibility into their Q/Q numbers; most of their contracts are with large enterprises (e.g. the US Navy) and last for multiple years. No contract, iirc, comprises more than 8%ish of quarterly revenue, so there’s lumpiness, but this isn’t analogous to a project-based business.
Regardless of the view on the underlying business, this is at minimum a management communication failure. You simply can’t guide like this, miss completely, and then pretend like nothing is wrong. The average investor just looks at this, feels burned, sells the stock and moves on — applying the heuristic that if you can’t trust management you shouldn’t be in the stock.
Boy, was I tempted to do the same. There’s something deeply unlovable about owning Haivision stock. The setup looks so clean — mission critical best in class at its niche with enterprise/gov contracts, 70% gross margins, insider alignment and massive operating leverage trading at <1x P/S. Then seemingly each time the stock has a good quarter it manages to sink back into the muck just as fast, dashing investor expectations. All the while the CEO handles every investor call like a victory lap. To be blunt: management communicates terribly — chronic overpromising and a victory-lap tone that never quite owns the misses. Whether that reflects the operating job is genuinely harder to say from outside, but the investor experience is real: anger, disgust, and a desire to be done with the security.
I suggest this is an excellent time to have a model. CAPY remains sort of steadfastly bullish on the stock, putting it at close to C$7/share e[IVPS] even following the disastrous Q2 print. Why? Broadly speaking I think it’s because CAPY never trusted management all that much, and therefore this most recent backstab is simply a slightly higher weighted posterior downward on the fundamentals rather than some shock breaking the model.
Equally, I think we should be on our guard here not to be overly credulous with our CAPY model. A fair bit of CAPY’s inputs are the financials and other filings of the target company. It’s not so great at psychologizing Mirko Wicha. Thus, if HAI is consistently obfuscating in its financials, or management is otherwise poorly aligned with the investor base, this might slip through the cracks.
I suggest there’s a not particularly complex but highly consequential list of diligence questions to answer on HAI: (1) Is management fraudulent, incompetent, or just tone deaf, and in what way(s)?, (2) Is there anything fundamentally broken about the assets or positioning, and (3) What can we expect from the next few quarters?
Let’s take a look.
A lot of this boils down really to the management question. Let’s begin with alignment. Wicha takes a $670K base, a cash bonus targeted around 43% of salary (capped near 119%) that pays out against a board-set Adjusted EBITDA budget, and long-term equity through the company’s option/RSU plan. In FY2024 that came to a $251,896 bonus (38% of base, ~78% of target, in a year where Adjusted EBITDA of $17.3M beat budget by ~17%) and ~$1.6M of total comp. Rabinowitz is built the same way: $572K base, $180K bonus, ~$973K total. It’s a fine structure but not a great one: base salary is a big slice, the bonus keys off a management-set EBITDA budget rather than per-share value or return on capital, and the equity grants are modest for a founder-led microcap. The alignment that actually matters is the stock he already owns. Wicha controls ~14.6% of the shares (including family; ~7.5% personally) while CFO Rabinowitz owns ~2.1%. Overall, quantitative shareholder alignment is unusually good: high but not oppressive insider ownership.
Next, let’s take a look at management’s performance over the long term, so as not to get overly anchored to the most recent quarter.
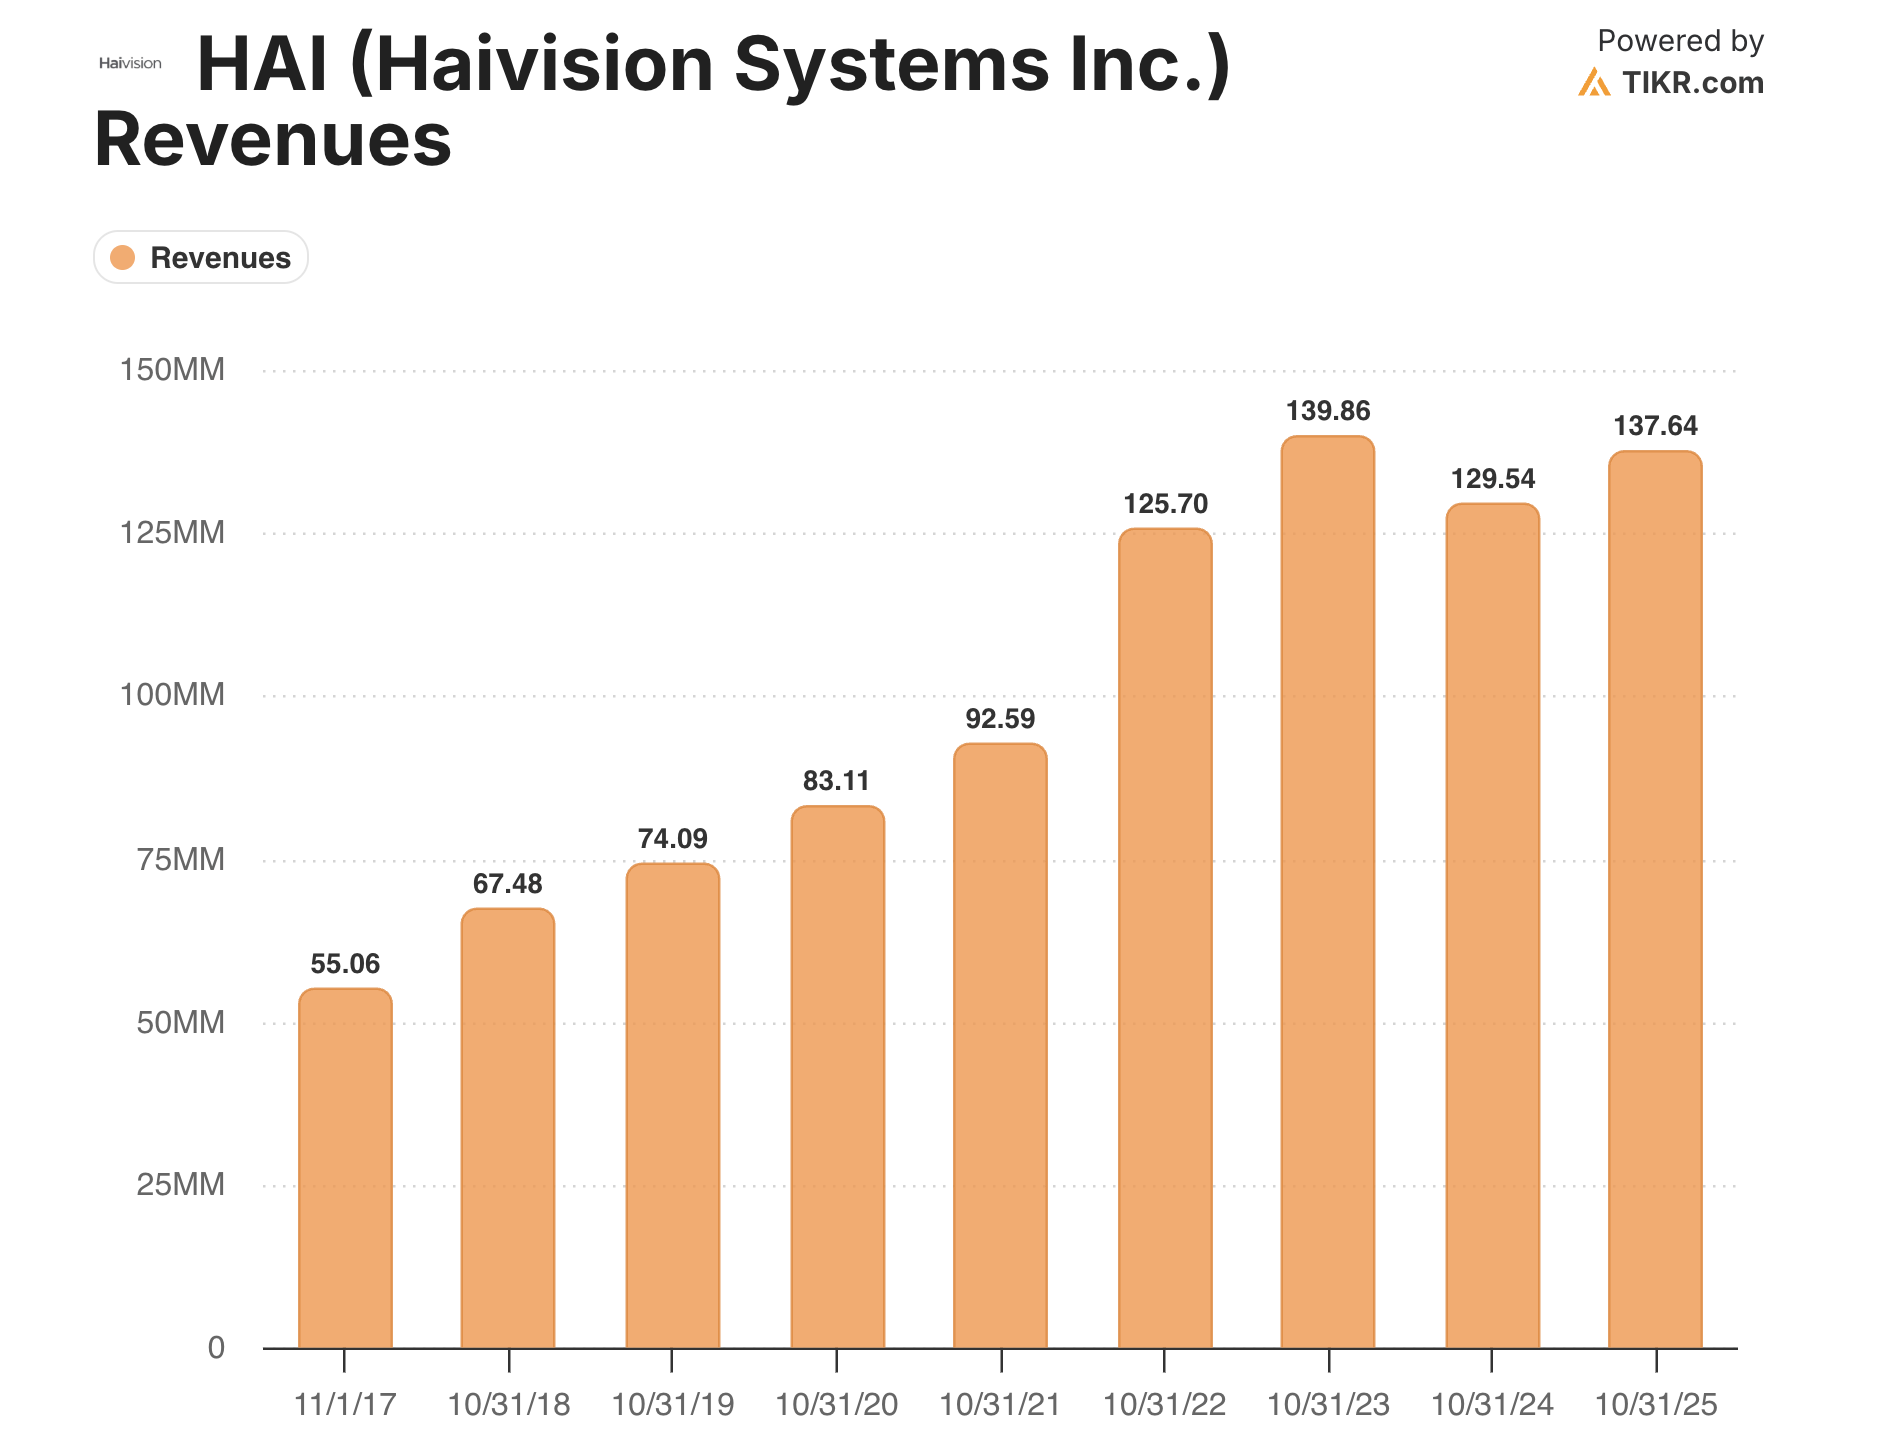
We have topline growth from 55m to 138m over eight years (FY2017 to FY2025), for a CAGR of ~12% over the sample. Not bad! Additionally, the company cites a 20% CAGR since its 2004 founding (per its Annual Information Form), under Wicha’s stewardship. Thus there is some basis of Wicha doing what he says he’s going to do.
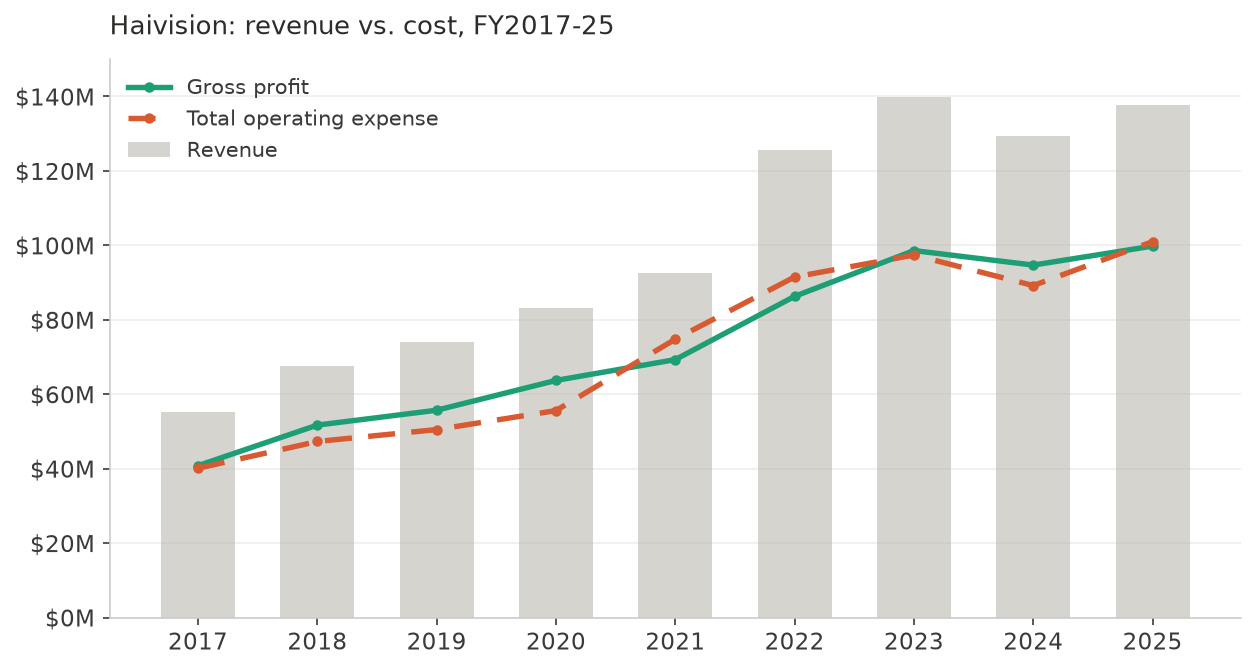
The cost lines on that same chart tell the rest:
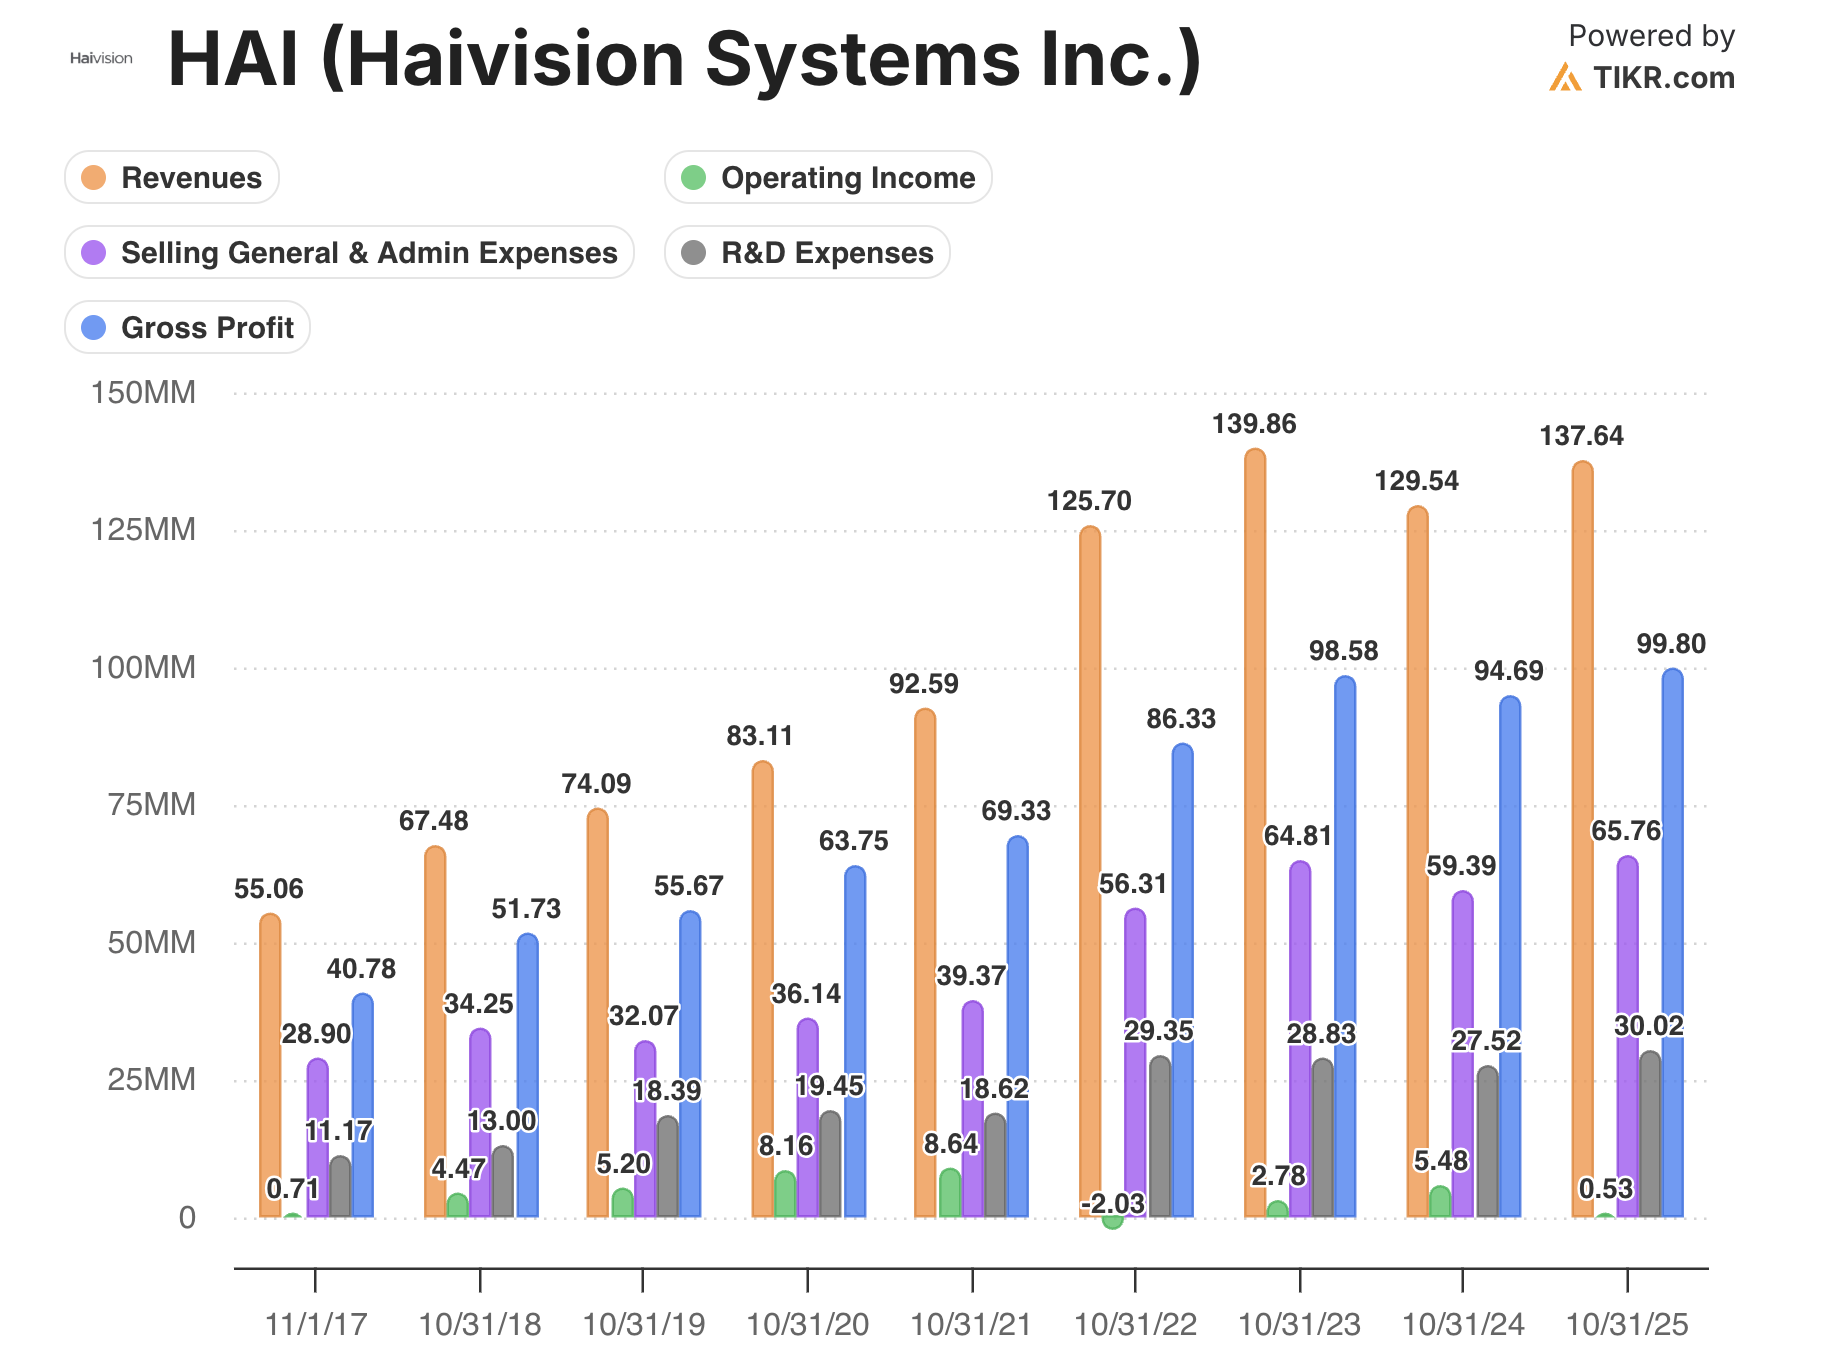
From a first order perspective, here’s the problem. The orange (topline) has been compounding just fine, as has the blue (gross profit), but unfortunately HAI has managed to never make money ever because the cost structure has compounded just as fast. R&D has gone from 11m in 2017 (1/5th of rev) to 30m in 2025 (~a fifth of rev) while SG&A has gone from 29m to 66m over the same period. Thus from a 1st order perspective we have seen all of the topline growth eaten up by spending. Practically speaking though these things aren’t so separable. SG&A/R&D can rise for a variety of reasons: HAI could be gaining technical advantages, it could be simple waste, could be large marketing budgets to maintain topline or any number of other things. I like to borrow a mental model from physics here: is HAI in a static or dynamic equilibrium and why?
A static equilibrium is one where each $1 of topline growth goes 1:1 with an increase in costs. This is fairly rare south of the gross profit line in public companies but it is possible. Consider say a company with extremely high marketing spend and R&D needs to maintain its edge over competitors. Just treading water vs the competition (and relative to the size of its niche) eats up all of the topline growth.
A dynamic equilibrium is one where multiple contingent (or stochastic factors) push in opposite directions, leading to a regime where the pushes and pulls roughly cancel out over a long period. The key feature of a dynamic equilibrium is ex ante instability (good for us in this case, though double edged) where once one side of the dynamics dominates the system can be pulled into a new attractor basin.
To me, that’s really HAI in a nutshell. Can it reach “escape velocity,” i.e. grow topline at 5-10%/year while keeping costs stable enough to return cash flow to shareholders?
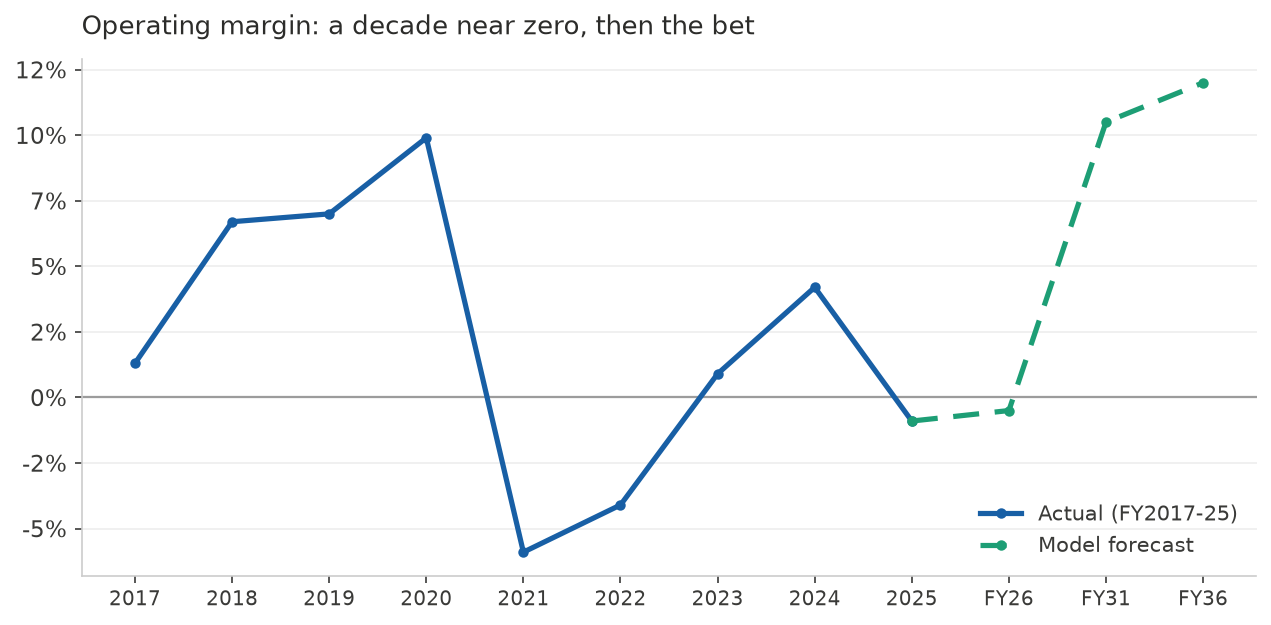
Now I have to confess, I got a little obsessive on this name. My prior was that somehow I’d have anchored on initial investment when the growth story was still intact and then doubled down by having my models treat the previous regime as a prior and then only updating insufficiently on the posterior evidence of the recent disastrous quarter, resulting in overconfidence.
My first crack at this was simply doing UPDATE->HITL. The main change I made was explicitly mandating varying margin paths in the SCENARIO layer of CAPY. How this works is that the naive model took events mostly as driving pathing, (e.g. “defense supercycle”) which is reasonable but ended up being hard to parameterize as the “base case” became monotonic margin expansion. I also went pretty hard on the research angle, looking at each of their end markets, competitive positioning and their new product launches. The result: I got an e[IVPS] of ~C$9/share (post HITL where I chopped away at it by mandating a high probability “tread water” scenario) which is again a wide discount to the model’s read. For this writeup I’m anchoring on a clean de novo CAPY run rather than the UPDATE path. The two land in the same neighborhood (de novo e[IVPS] ~C$7 vs my UPDATE-then-HITL ~C$9, both well above the ~C$4.6 tape), so the choice is about clarity, not conclusion; the de novo is the cleaner, more self-contained number to share.
I then sat down to write this post and came away feeling unsatisfied. The nagging problem with HAI is that most companies have a few clear narratives, while HAI seems to have this morass of probabilities with uncertain magnitudes, high sensitivity to assumptions, and the albatross of untrustworthy management making it hard to model. I felt I needed to keep thinking until I had a more parsimonious mental model for HAI such that I could write about it to a reader, and have them come away with some feeling of “understanding” the business (w/e that means exactly).
One trick I do in this situation is to keep inverting or shifting conceptual frameworks until one (or a few) tend to explain all the facts. One of my favorite inversions is to flip from being an equity holder to being a manager. What if I owned 100% of this business and operated it? What would my options be? I think in HAI’s case it’s quite instructive because it lays out the degrees of freedom and explains all the facts fairly neatly.
So let’s pretend we’re Mirko Wicha. One thing I haven’t fully hit on yet is that HAI is Wicha’s baby; prior to going public he grew topline at 20% CAGR for years. Most of the struggles are “recent”, from the PoV of Wicha’s inside view. Thus when we skewer him for missing guidance and hammering on about a sustainable 10% topline CAGR it’s worth mentioning he did actually do 20% for a bunch of years before he had to start talking to investors. That’s a thing that happened! Second, Wicha owns ~14% of the company, and is therefore fairly well aligned with shareholders. The options package leaves a lot to be desired and salary does make up a fair bit of his compensation so it’s not perfect, but nonetheless it seems clear he wants the stock to go up.
Now, getting to the meat of it. I think the best way to think of HAI from Wicha’s PoV is that really whenever he likes he can go into “harvest” mode as opposed to “build” mode. In other words, he has options. The easiest version of this argument is the R&D spend which is currently at close to a fifth of revenue. Imagine in build mode, R&D is maximized to keep innovation leadership and grow topline over a multi year timeframe. By contrast, assume in harvest mode R&D is minimized to say 5% of revenue to do the bare minimum and FCF is harvested. If rational, Wicha is saying that build > harvest for long run returns. But given HAI is running ~adj. EBITDA breakeven at the present moment on a ~$130m market cap, taking that 30m in R&D spend and reducing it by 25m to create a 25m in EBITDA completely transforms the company from a naive investor perspective. Why is this important? Well, it squares the circle of why a business like this (with 70% GM reasonable sticky relationships) just should rarely trade <2x EV/sales in most cases as the acquirer can simply turn on the taps to harvest the cash when they wish.
It’s worth mentioning the harvest story is likely even more extreme than this. There’s 66m in SG&A, of which ~29m is sales & marketing. In the harvest scenario, some of this is discretionary, let’s say ~10m. Thus in the harvest scenario we can imagine something like 35m in EBITDA.
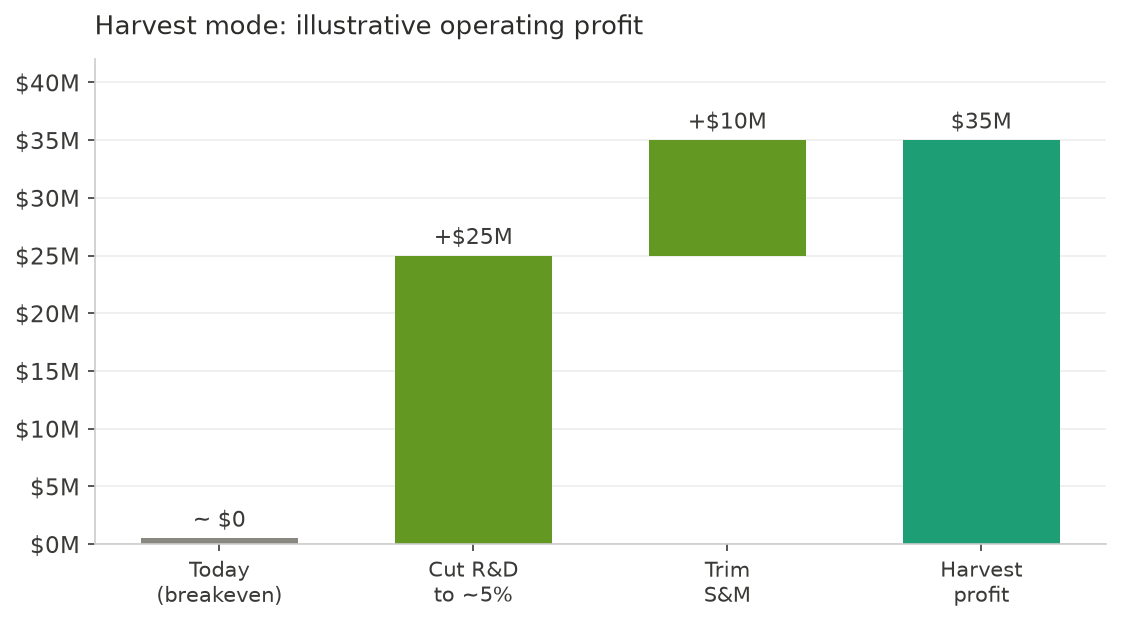
Now let’s invert the counterfactual and imagine what a CEO might do in build mode. Here, we delay the harvest to take share and build off of a bigger base. In fact, we might wish to eventually sell at a premium to a bigger shop, meaning we don’t even need to necessarily oversee the harvest phase. Here, we mostly keep our EBITDA neutral to moderately positive, while attempting to grow topline, maintain product leadership and take share. Now this doesn’t mean we’re going AMZN/COST/Malone style full scorched earth to avoid taxes or earnings. Probably a more measured approach works here — we’re a tiny business in a small niche with more cyclicality and volatility than those behemoths. The plan then is more to push for growth, but also satisfy investors to some degree, stack some cash and make the odd bolt-on acquisition for scale. If that sounds familiar it should, because as far as I can tell it’s almost exactly what Wicha is doing. The problem is he’s not doing it very well. A ~10% 5 year topline CAGR during the growth phase with little cost discipline and repeated misses on expectations isn’t quite what we were looking for. Make that 10% topline 15% (even with higher costs) and it’s a totally different stock.
Now it’s always more complex than this in the real world and there’s many, many shades of grey and little incentives that drive us away from these broad generalizations. My point however is that HAI has options to move between regimes, and is currently prioritizing growth. I take the view that a business with ~100m in gross profit and this many levers to pull on the operating expense side has no business trading at <2.5x EV/gross profit. That higher range is really a comps point: control deals for comparable assets clear well above where HAI trades (the rejected ~1x-revenue Evertz bid was a lowball; genuine control comps run 3x+ revenue), because an acquirer can turn on the harvest lever. Public-market investors myopically read the poor communication and lack of present-year FCF growth as harbingers of a terminally poor business.1
All that being said, none of these analytical gyrations help us escape from the single basic fact that decides HAI’s future — will Wicha deliver the promised growth (and/or cost control) and when? The operational history, as I’ve said, is quite clear here. He has mostly done the “what” (delivered the growth) but sometimes less than promised and always late. This is likely to continue. So will the next 5 years be 5% CAGR topline or 15%? It’s almost impossible to know. Most of HAI’s end markets for its latest product slate are growing in the 5-7% CAGR type range and HAI’s probably growing around there as well. Thus to me, 10% would be a fairly good case from here while ~6% is my midpoint. On the other hand, both R&D as a %/revenue and sales & marketing as a %/revenue are near their maxima, which in a rational world should presage some inflection in topline and/or go back towards historical means. But I think we must set our expectations low for this management team.
The cleaner way to hold it: the business can inflect, and the harvest math settles that. The real question is whether the reinvestment converts to harvestable profit, and when, and that timing sits with Wicha and the defense cycle, not with me. So this is less a bet on management getting “disciplined” than a floored option: the downside is cushioned around here by the strategic-takeout value and net cash, and the upside is the one path that does not need Wicha to change his stripes, the Navy ramp pulling revenue up faster than he can spend it. The unlovability may even be doing me a favor, with the market taxing a communication failure as if it were an operating failure. If the build is real and only the investor relations are broken, I am being paid a discount for a fixable problem.
Summing up, what I like about HAI is the general business quality — leadership in a growing and defensible niche with 70% margins and an aligned management team. The problem is reaching escape velocity. My view is that HAI is in a dynamic equilibrium rather than a static one, and that management is continually pushing (optimistically but fairly rationally) to grow the firm. The current price of ~C$4.5 represents something below the “strategic floor” of a ~1x EV/revenue takeout in the mode of the rejected Evertz 2023 offer. So of course there’s still downside here, but I think permanent loss of capital risk is manageable. By contrast, the upside is genuinely asymmetric. If they can simply put together a few quarters of 5%+ topline and control costs, there’s a credible path to C$6; C$10 comes into view if the defense ramp does the heavy lifting. Nothing about their end markets or product quality makes that look heroic.
Finally, if this wasn’t glaringly obvious yet, HAI is going to have a highly volatile print to print IRR. The major drivers are going to be topline trajectory, new contract orders / backlog as disclosed, and cost discipline. I think more than most companies a driver will be narrative and management communication to a disaffected investor base. The rest of 2026 is likely to be bad, with continued downward GM pressure due to cost increases from AI-affected components that can’t be fully passed through to customers. Then there’s the general lumpiness of the business and the volatility of the pace of uptake of all the newly launched products. The market is likely to react violently to these little pieces of information in ways that are likely significant over reactions to the long term value of HAI. I will hold my shares and see what develops.
CAPY Research publishes experimental, model-generated valuation research and general market commentary for informational and educational purposes only. It is not investment advice, not a recommendation to buy or sell any security, and not a price target. Outputs such as e[IVPS] and e[IRR] are experimental estimates produced by a software model and reviewed by a human; they are not forecasts of actual returns and should not be relied upon for any investment decision. The author or affiliated parties may hold positions in securities discussed. Do your own research and consult a licensed financial advisor before investing.
It’s worth mentioning that in 2023, Evertz first amassed a ~10% stake in HAI, then made multiple bids for the firm culminating in a bid of $4.75 / ~1x gross profit. This was rejected by the board. Apples to apples that suggests a low bound strategic would bid something like $5/share for HAI today, which acts as something as a soft floor on pragmatic liquidation value. This is all theoretical though as I don’t see Wicha selling for <$15/share.