

**Disclosure:** I am long Haivision Systems Inc. (TSX: HAI) in personal accounts. CAPY Research and its principal may buy or sell securities discussed here at any time. I received no compensation from Haivision or any other issuer or third party for this post. This is research and commentary, not investment advice.
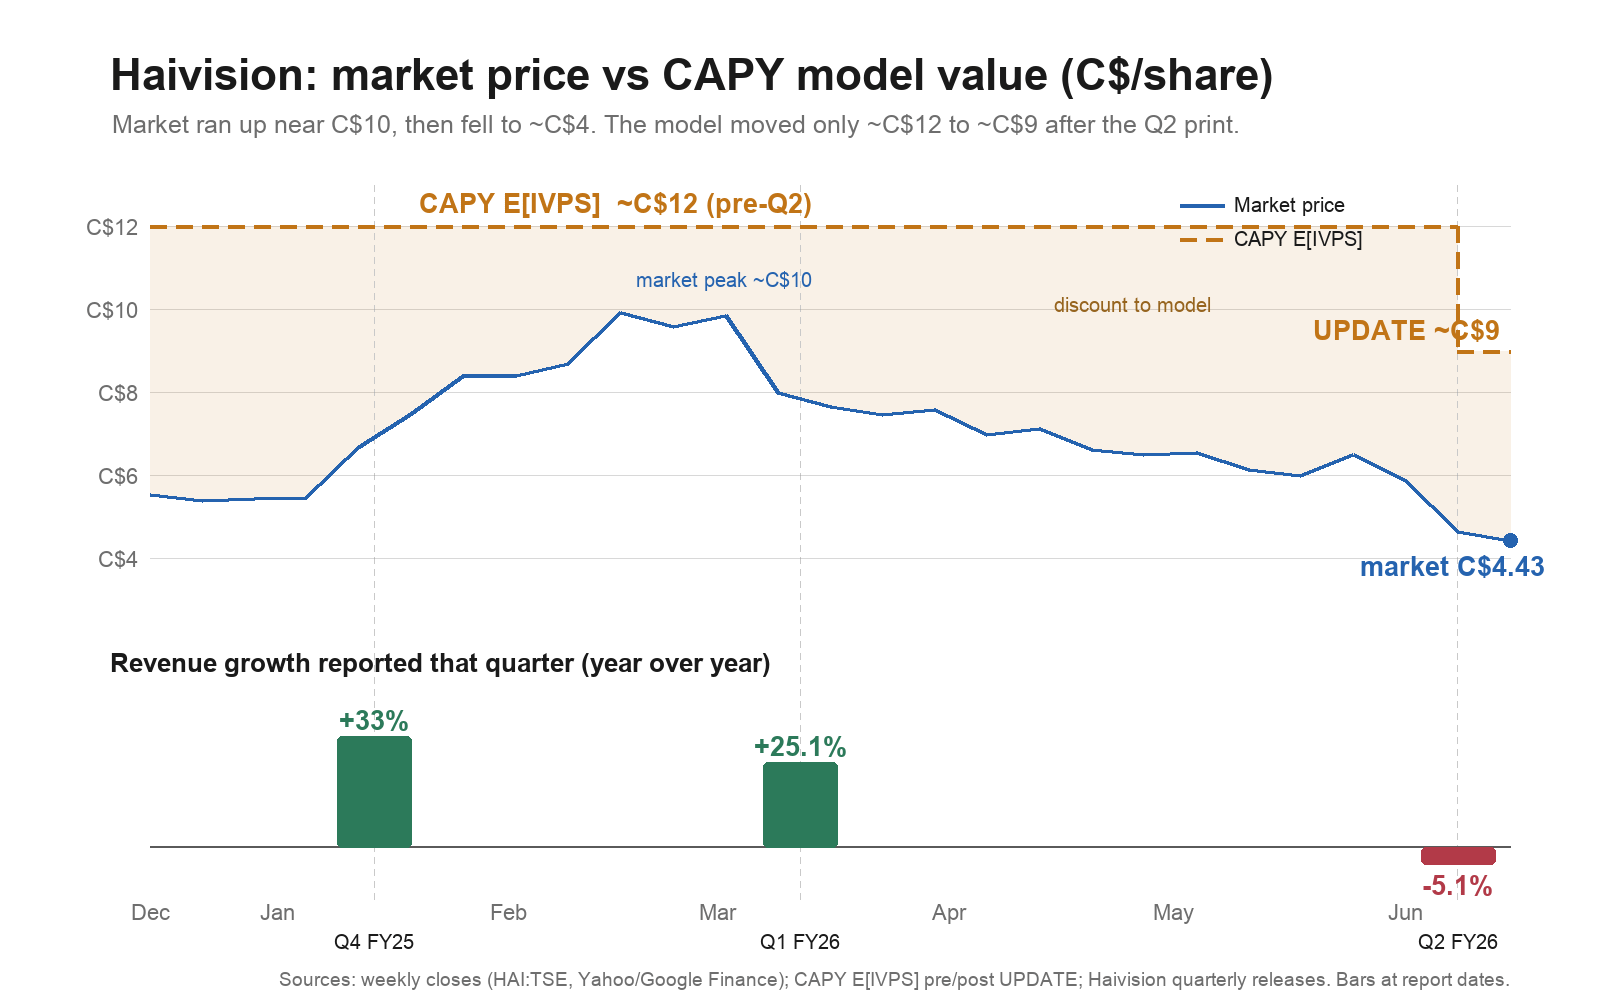
Perhaps the time I’m most grateful to have a model and a process is when I get a good solid gut punch.1 Gut punches work best through vivid examples, so I’ll share. I own shares in Haivision Systems Inc. (TSX: HAI). I’ll deal with the gory details in a separate deep dive post, but let’s just say the recent Q2 FY2026 print was not so good. Revenue declined 5.1% year over year, gross margins fell to 68.9% from 73.0%, adjusted EBITDA margin fell to 1.0% from 4.9%, and management guided down, citing budgets being reprioritized toward defense readiness and AI infrastructure and the resulting timing pressure on sales.2 The stock traded down from a perhaps slightly euphoric C$10.40-ish high in March to around C$4.40 post earnings.
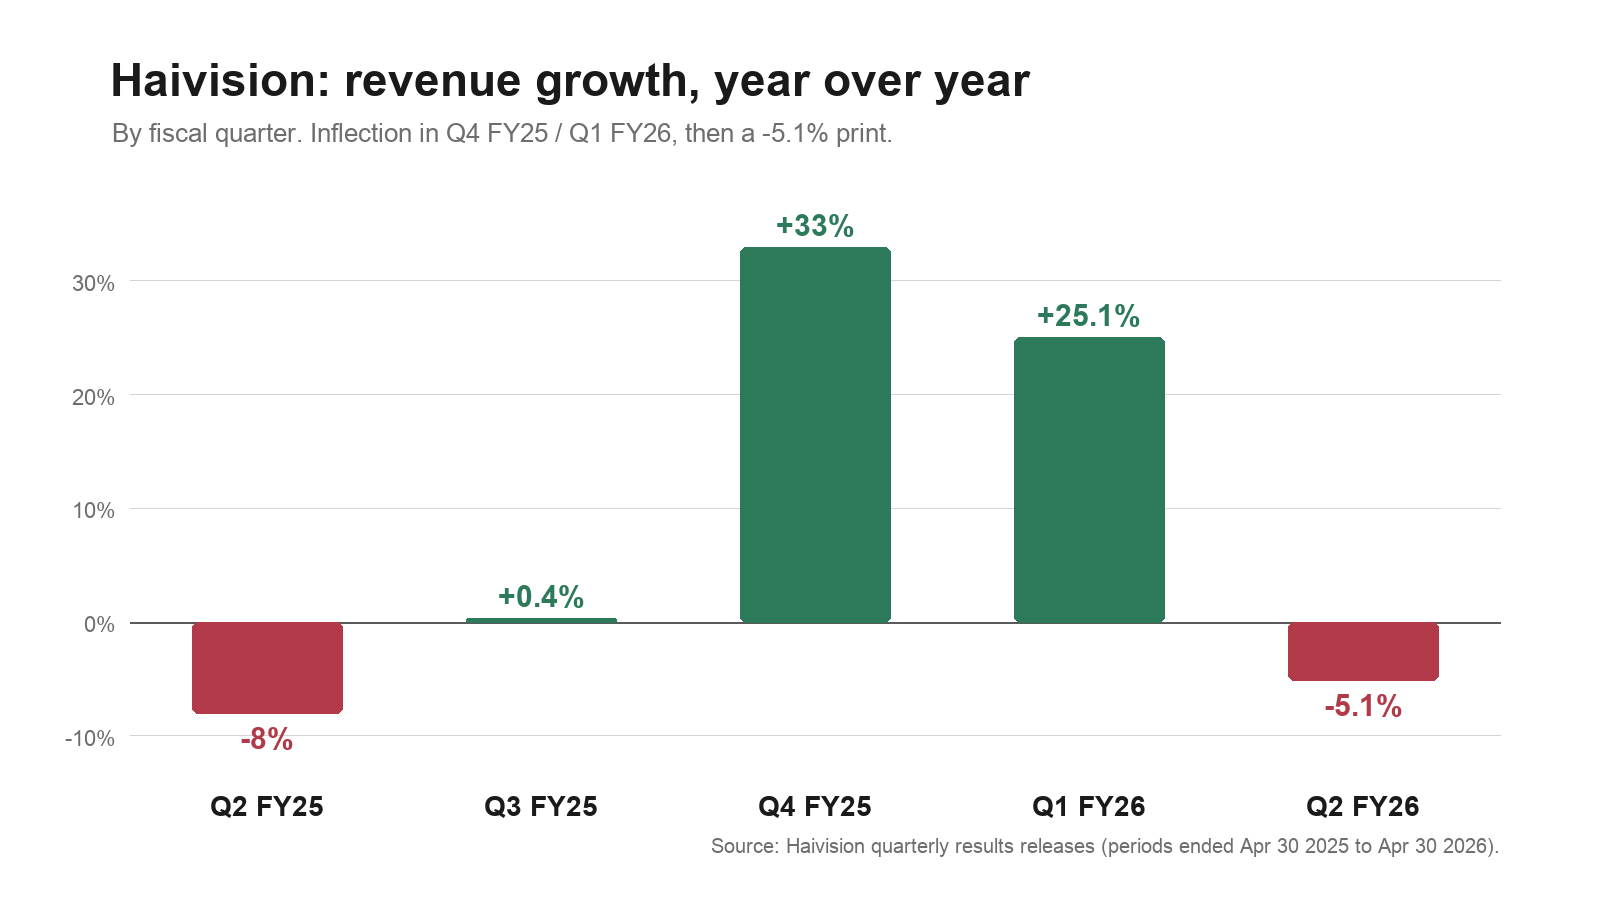
What’s worse is that these events co-occurred in ways that tend to undermine investor confidence (and my own). Looking at quarterly revenue, management had been telling a story of 2025 being the nadir of HAI’s revenue growth stall. Now management has a long history of overpromising and delivering only partially and behind schedule, so this was taken by the market with suitable grains of salt. But then in Q2 ’25 through Q1 ’26 we see the promised inflection with topline vs prior year at -8% -> 0.4% -> 33% -> 25.1%, which supports management’s narrative of a “return to double digit secular topline growth.” And then, it all came crashing down, with a -5.1% Y/Y comp and weaker forward commentary in Q2 ’26.
The purpose of this post isn’t to litigate HAI’s business prospects; it’s only to illustrate the situation. The setup was: buy HAI at <1.5x EV/rev on ~70% GMs, with management promising to return to 10%+ topline growth and operating leverage. It seems to be happening, stock is up. Then it falls apart. What should we do?
In these cases, many investors use pattern matching, heuristics, intuition, and just plain panic to arrive at a decision. I could say something prima facie pretty convincing here:
My thesis on HAI was a forgotten quality compounder set to return to growth with massive operating leverage. Management have failed the credibility test. Time to cut my losses.
Or I could say:
My thesis on HAI was a forgotten quality compounder. They proved in the last few quarters that end market demand for their products remains strong and hit a significant hiccup this Q when Navy deliveries appeared lumpier than advertised and rev growth was pushed out to 2027. At <1x EV/rev, this is a buy/add scenario.
My view is that neither is actually all that helpful, and both tend to be heavily biased. Instead, what I prefer to have is a process.
As discussed previously, CAPY outputs a report/model and I do a human-in-the-loop (HITL) adjustment. I also have a utility called UPDATE that essentially takes the CAPY outputs as a prior and recursively runs the CAPY process over again with the new quarter’s information (and supplementary research). I can then run a HITL process and audit/refine the updated model.
The major property of these UPDATE runs is that the market typically gets it right directionally, but overestimates magnitude. On the other hand, we must be wary to sniff out a regime shift, and whether some assumptions in the initial model were invalidated at a root level such that the future may not be like the past.
From the narrower point of view of governing my own behaviour, these UPDATE runs are invaluable in cases like these. Left spinning in my own head, I’m asking thought loops that sound something like, “If my model predicts mid to high single digit monotonic topline growth + operating leverage, but management cannot be trusted to ever hit guidance, then wtf am I even doing here? I should just sell and move on with my life,” or “How can the market possibly value HAI at <1x EV/rev on top of a secularly growing technical niche, 70% gross margins and comparator comps in a sale scenario being in the minimum 2x EV/sales range?? These are long term government contracts and I should add / wait it out.”
But note that neither of these contains a particularly actionable diligence checklist that maps back onto a quantitative output that can compare each of these takes apples to apples. So I’m left with distrust of management on the one side and a cheap asset on the other with no bridge.
CAPY comes out more measured. These are model estimates, not price targets or recommendations, but the bridge is useful:
Pre-Q2 FY2026 E[IVPS]: ~C$12/share.
Post-Q2 UPDATE E[IVPS]: ~C$9/share.
Post-print market price: roughly C$4.40-C$4.60/share.
Main change: worse near-term revenue/margin evidence and a larger management-credibility haircut, not a full thesis break.
Note that CAPY never actually believed management’s claims at face value; the model always thought ~5-7% topline before asymptote was more realistic. Thus the +25% quarter was under-modeled and the -5.1% quarter was therefore less thesis breaking. The model thinks HAI is roughly similarly undervalued today as when I bought the shares. Should I have sold when it got to ~C$10.40 and the model thought it was worth ~C$12? Maybe, but not obviously yes.
There’s something reassuring about this. More importantly there’s also a series of diligence items that can be researched on top of the revised valuation to underwrite the pain points:
Revenue trajectory: one bad quarter, delayed program timing, or real demand problem?
Management credibility: what did management guide or imply, and how often did they hit it?
Margin bridge: temporary mix/component pressure or structural degradation?
Product positioning: are the defense/control-room tailwinds still intact?
Scenario update: what would make the ~C$9 E[IVPS] wrong?
This is where having a robust artifacted base model in repo makes things much easier. Instead of shouting into the browser-based chatbot void, “is HAI management credible?”, I can use the various model versions along with the research corpus as input/framing, and then send agents to answer specific diligence questions and tie those answers back to line items in the valuation. Thus, I can look at say management adj EBITDA projections in all call transcripts since 2020, compared with actualized adj EBITDA and note the sign of the deltas and the accompanying rhetoric.3
This tends to yield a more nuanced picture and one which disinvites bias and/or panic, or at least makes the question decidable rather than an a priori mental loop. I might even have a prior in my mind that I make explicit: if management repeatedly misses adj EBITDA targets and guidance by >X% and Y timeline, I’ll sell. In practice I usually won’t be that rigid though, it’s more of a mosaic. After hitting the details and sitting with it for awhile, my mind tends to find a pretty comfy attractor state of either buy/sell/hold. I suggest this doesn’t always lead to the most cathartic response to bad (or good) news, but over time it’s the sort of discipline that humans tend to be the worst at, and which a solid model helps ground.
CAPY Research publishes experimental, model-generated valuation research and general market commentary for informational and educational purposes only. It is not investment advice, not a recommendation to buy or sell any security, and not a price target. Outputs such as E[IVPS] and E[IRR] are experimental estimates produced by a software model and reviewed by a human; they are not forecasts of actual returns and should not be relied upon for any investment decision. The author or affiliated parties may hold positions in securities discussed.
Interestingly the converse is also often true; it’s good to have a rigorous process when things start going amazing and we have to make a principled analysis of what to do with shares.
For those interested, the result is more mundane. The CEO, Mirko Wicha, tends to be directionally accurate but mildly optimistic as regards timing, and moderately to highly optimistic as regards magnitude. At times they’ve hit that 20% topline CAGR for significant periods but other times regressed. CAPY has something like an 8% CAGR built in off of a low base for the early years before sharply asymptoting to closer to GDP growth. Non-heroic but still requiring execution.